MiraMon Map Browser and Server
This technology allows to bring your maps to the Internet with nothing else than the usual web browser. It's very easy to use and it offers high-quality detailed maps combined with analytical and statistics capabilities, following the most common OGC standards.
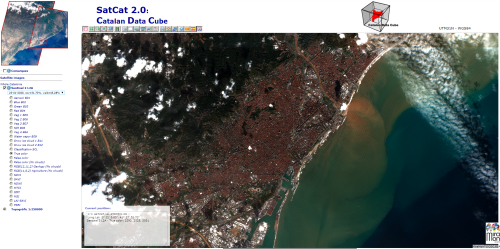
Some examples of the MiraMon Map Browser can be seen here.
What we offer
MiraMon Map Browser
The MiraMon Map Browser is a tool for visualization, analysis and download tool that runs in modern web browsers. Only based on HTML5 and JavaScript it uses Open Geospatial Consortium web service and APIs to connect and show the data to the user ad a map. The JavaScript client is able to combine AJAX, binary arrays and the WMS/WMTS protocol. In the case of remote sensing data, the information is structured in coverages.
The MiraMon Map Browser is a long term developing effort from the MiraMon team. The objective of the development is to assign to the web browser and the JavaScript engine as much work as possible, limiting interactions to the server the minimum possible and the transfer of information to a format that is as raw as possible. This approach can be surprising, these days where many application prefer to perform processing functionalities in the cloud and not in the client machine. Most of the time, the MiraMon Map Browser is the direct responsible to create the visualization on the fly based on the raw data, allowing the user to change visualization properties, perform analysis, statistics or build time series in the client side directly.
The user is able to perform queries to the data in a more dynamic way, apply spatial filters, enhance contrast, changes palettes, create diagrams (e.g. histograms and pie charts), generate animations and graphics of a time series, and performing complex calculations among the coverage bands of the different available datasets.
Several layers of data coming from different servers and using different protocols can be overlaid simultaneously. Some layers represent data from a single dataset while other can be a virtual datasets computed on the flight in each zoom and pan, and created by combining data from more than one dataset and server.
The legend has two functions: on one hand, it provides information on the visualized information in the map view and on the other provides control to what is going to be visualized.
Basic functionalities
- Raster visualization and query by location by using OGC Web Map Service (WMS) and Web Map Tiled Service (WMTS) and OGC API - Maps and OGC API - Tiles.
- Dynamic raster analytics by using OGC WMS by transmiting binary arrays of values, raw or RLE encoded, instead of pictorial representations.
- Pixel based analysis is performed directly in JavaScript in the client side and visualized on the fly.
- Vector visualization and query by location is possible using OGC Web Feature Service (WFS) and Sensor Observation Service (SOS). The client accepts both XML a JSON formats.
- Direct visualization of GeoJSON and Cloud Optimized GeoTIFF (COG) from the Internet or in local drive.
- Switch a layer semi-transparent, on and off.
- Change the visualization style of a layer.
- Get metadata about the layer.
- Data download (limited to the use of OGC Web Coverage Service v.1.0).
Advanced functionalities
- Filters on raster and vector layers, and over on-the-fly calculated layers.
- Animations/video.
- Support to quality and uncertainty specifications from QualityML.
- Compute quality measures.
- GeoSpatial User Feedback (GUF) integrated.
- Layers overlapping (including calculator operations).
- Confusion matrices calculation.
- Raster reclassification.
- Previous state/view recovery.
- Support to provenance.
- The user can add new layees.
- Reorganization of layers in the legend.
- Support to multiple projections.

Analytical functions |

Histograms and pie charts from the current view |

Connection to the QualityML dictionary |
MiraMon Map Server
MiraMon Server is a stand-alone CGI application that runs on Windows operating systems that can be used in combination with a web server such as Internet Information Server or Apache for Windows. It is the ideal solution for people that already uses MiraMon professional on desktop because it uses the same MiraMon formats in the back-end. MiraMon server is based on the same libraries that are used by MiraMon professional and has the same capabilities in terms of CRS support, interpolation algorithms, MMZX compression, etc. One particularity of the software is the internal tiled schema required to serve maps and tiles in a fast and scalable way. MiraMon Server uses OGC web services as a baseline for the interaction to the client. Currently, MiraMon server provides support for the following standards:
- Web Map Service (all versions)
- Web Map Tile Service (all versions)
- Web Coverage Service (version 1.0)
- Web Feature Service (version 2.0)
- Web Processing Service (version 1.0)
- Sensor Observing Service (version 2.0)
MiraMon Server Sensor Observing Service (SOS)
The Sensor Observing Service capacity is used in tandem with the Web Feature Service and uses the same MiraMon topologically structured formats in the back-end. It has been developed in the Ground Truth 2.0 project to server interoperable data from the Citizen Observatories created during the project. The current implementation is incomplete and only supports GetFeatureOfInterest and GetObservation operation with limited capabilities. The objective of the minimum capabilities developed was to respond to the requirements of a viewer client needs to represent a map of the features of interest provided by the service and to allow for a query in a point to get more information about the observations there. Each dataset in MiraMon becomes an observedProperty in the SOS service. Each observation is a position in a PNT file that has a DBF record associated that is transformed to an O&M DataRecord automatically. Internally, it is possible to mark field names in the DBF that are associated to concepts in the O&M such as the phenomenon time and the user name.
Data Cube Technology
The Open Data Cube, is a system developed to easy access, manage and analyse a multidimensional cube (x, y and t bands) of RS data. The main idea behind the datacube chases after minimizing the required knowledge to access and process remote sensing data and work efficiently with time series, thus transforming how users interact with large spatio-temporal RS data. In fact, the Open Data Cube is an open source initiative participated by several organizations from CEOS to CSIRO. The DC is based on a set of Python libraries and PostGreSQL database that helps on working with geospatial rasters, with special emphasis on analysis ready data.
GitHub code repository
Go to the MiraMon Map Browser GitHub following this link.