-
 CreaTIN: TIN models generation from a point cloud
Direct access to online help: CreaTIN
Access the application from the menu: "Tools | Terrain interpolation and analysis | Thiessen polygons generation"
Presentation and options
This application allows generating a triangulated irregular network (TIN) from a file of points.
A TIN is a set of adjacent triangles, non-overlapping and without topological holes, built from irregularly distributed coordinates coming from points (such as elevation spots), lines (such as ridges or channels) or polygons (such as the edge of a lake). Being a vector model, it respects singular points such as peaks, valleys, etc.
The application CreaTIN allows making a selection of the input points file, as well as to use the Z coordinate of the points, in case it is a 3D file, or to use a numeric field of the database as Z coordinate that will be assigned to each vertex of the output triangles. In addition, it allows to use points that have NoData height (in case of choosing to use 3D dimension) or with empty label (in the case of assigning a field).
The input file must be a point file in PNT format and the output file will be a polygon file in POL format.
When querying the resulting polygons by location, the user will obtain the dimension calculated in the plane of the 3D triangle in case of clicking inside the polygon, the dimension calculated along the trend of each edge of the triangle in case of clicking on one of the edges of the polygon, and the coordinate of the vertex of the triangle in case of clicking on one of the nodes.
The created table contains several fields of interest for each triangle:
- D Perimeter and 3D Area (calculated in the cartographic projection of the layer, it is a complementary information to the perimeter and area on the projection plane, or on the Earth ellipsoid),
- Slope and Orientation, in degrees; the orientation is provided following the usual criteria: 0° for triangles oriented to the N, 90° to the E, etc; flat triangles, as they are not oriented, leave the orientation blank.
If the user provides points from contour lines, without complementary elevations, in some areas, particularly inside the curves of the peak areas, coplanar triangles will be generated. The slope of coplanar triangles is 0, and the orientation, if left undefined, is written blank in the table of triangular polygons created.
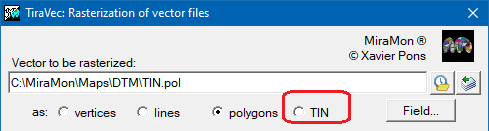
To convert the TIN layer into a conventional DTM (raster), use the TiraVec application in TIN mode:

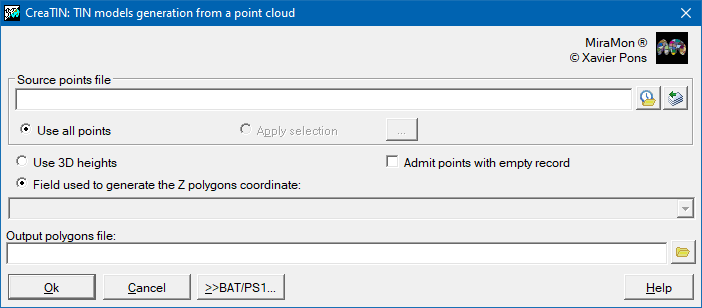
Dialog box of the application
Graphic examples
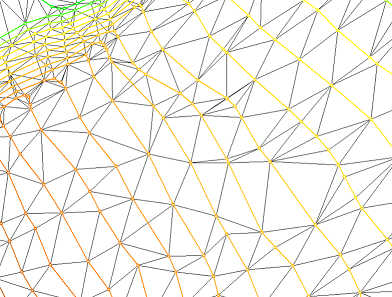
Example of a TIN grid (in black) under the isolines (graded colors according to the value of the isoline) from which it was created
Note that the vertices of the isolines are symbolized, which have become vertices (all nodes in this case) of the triangles
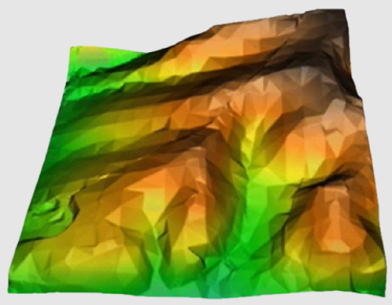
Example of the result of rasterizing a TIN through TiraVec in TIN mode
Font: Mitas, L., Mitasova, H. (1999). Spatial Interpolation. In: P.Longley, M.F. Goodchild, D.J. Maguire, D.W.Rhind (Eds.),
Geographical Information Systems: Principles, Techniques, Management and Applications, Wiley.
Syntax
Syntax:
- CreaTIN 1 InputPNTFile OutputTINFile [ZField] [/3D] [/NODATA]
Options:
Only option in this version of the program. The value "1" must be added in the command line.
Parameters:
- InputPNTFile
(Input file of points -
Input parameter): Input file of points in PNT format.
- OutputTINFile
(Output TIN file -
Output parameter): Output TIN file in POL format.
- ZField
(Z field -
Input parameter): Field used to generate the Z coordinate of the output TIN polygons.
Modifiers:
/3D
(Use 3D dimension of the input points)
In case that the point file is 3D, the 3D dimension of the input points is used instead of using a field in the input database. (Input parameter) /NODATA
(Use points with NoData height or empty label)
Allows using points with NoData value (in case of using the 3D dimension of the input points) or with empty label (in the case of using a field of the input database). (Input parameter)