-
 Histo: Histogram of a raster
Histo: Histogram of a raster| Presentation and options | Dialog box of the application |
| Syntax |
This application generates a histogram of frequencies of a raster in IMG format.
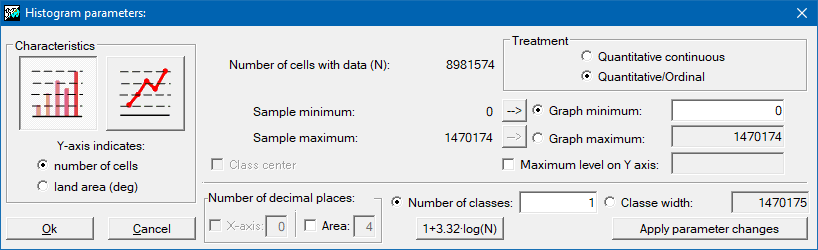
A histogram of frequencies is the graphical representation, usually formed by rectangles called bars, or by lines, of the frequencies of occurrence of a variable grouped in the intervals defined by the user (which can be of width 1 in integer variables of low range and then match the values of the analyzed data). In the histogram the variable to be represented is usually located on the horizontal axis and the height of each rectangle or line is proportional to the frequency of the value or interval it represents.
The MiraMon Histo application allows the user to create the histogram of a raster image, to display it on the screen and to save the result obtained in a CSV file with the frequencies and areas for each class in order to perform a deeper analysis in a spreadsheet. The user can define the parameters of the histogram to be obtained: graph type (calculation of frequencies or calculation of the area occupied by each class), treatment of data processing (continuous quantitative, quantitative/ordinal, categorical), minimum and maximum value to be represented in the histogram, number of classes to be represented, etc.
When a change is applied to a parameter, it is advisable to press the "Apply parameter changes" button so that the program displays the changes in the dependent parameters (typically in grey, non-editable).
The Treatment section has a different appearance and functionality depending on whether the data is quantitative or ordinal, or categorical. In the first case it allows the user to define the classes in real values when "Quantitative continuous" is selected, or in integers (unless data are already real) when "Quantitative/ordinal" is selected. In the second case (categorical rasters) the only possible treatment of the data is "Categorical".
The 1+3.32·log(N) button, where N is the number of samples, and it is available when the radial "Number of classes" is activated and not the radial "Class width", applies a common formula for a "reasonable" number of classes, although it should be noted that if the distribution is slightly Gaussian it will be necessary to make a better exploration of the number of intervals to obtain a representative histogram. In the above expression, log is a logarithm in base 10.

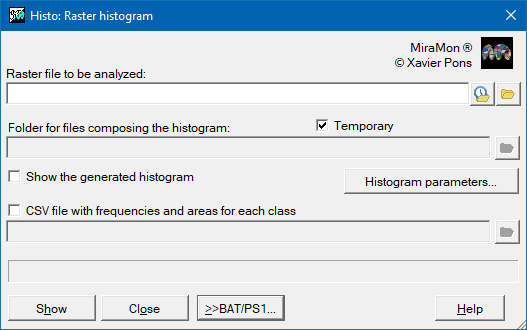  |
| Histo dialog box |