 |
View menu |
RedrawIt redraws the client area of our window. It is useful when some other application has modified our color palettes or if we want to display vectors over all the client area, without excluding the narrow bottom and right bands not redrawn when scrolling (see Zoom Menu). It will also be useful when we move a floating window over the map and a little frame remains at some window's sides (this frame is normal when it is less than one map pixel because MiraMon never shows pixel fractions). If you do not have a graphic board with thousands or millions of colors, but with 256 or 16 colors, and you are working on a window (not on the whole screen), when you return to MiraMon from another application MiraMon may show strange colors. In this case execute "Redraw" to force a correct redraw of the window. If you have loaded vectors and you do scroll or zoom operations, you can keep any of the Shift keys pressed to avoid vectors redrawing at every new view, so that the process of locating an interesting area of the raster becomes faster. See the "View | Interrupt vector redraw with Shift" for details. If you commute with "Alt+TAB" to another application that intensively uses color, sometimes the computer will emit a sound, pointing out that MiraMon's client area will be shown "empty" until it will be the active application again (it has the title bar highlighted). MiraMon automatically executes the redrawing when you commute to it again or when you press any point inside its area with the mouse. If you have the sound off (see Display Menu and/or "AvisaErrorRed" parameter of the MiraMon.par file) the computer does not emit a sound, but the automatic redrawing is executed anyway. Periodic layer redrawThis allows you to up-date the visualization of some of the structured vectors contained in the map. This is useful for maps in control centres that have to re-read the data from a database that is up-dated in real time (for example emergencies) and show them up-dated in a large reference screen. For example, you can have a reference cartography loaded and, on top of it, a layer in which emergencies can appear. We can indicate that the layer should be updated every minute using the data that arrives in real time. By doing this we can use an alarm symbol to display the points that are in a state of emergency at each moment. Redrawing only affects the layer involved and those above, and it can be frozen and unfrozen when convenient. For GPS tracking it is not necessary to activate the periodic updating because the GPSMM module configures it automatically. To define a update period in other circumstances it is necessary to include, in the desired section [VECTOR_#] of the MiraMon Map file or in the REL file or equivalent in the case of cartographic series, the key "RefrescPeriodic=n" where "n" is the update time in milliseconds. In applications that need to be updated the actual graphic entities (because they are being changed by an external agent) add the additional key "TipusRefrescPeriodic=1". EnvironmentThis option allows to show or hide the button bar, the zoom bar (which appears floating above the window), the scroll bar, and the status bar. SpecialInterrupt vector and WMS/WMTS redraw with Shift When there are many vector layers or WMS services loaded and/or these are very complex, it is sometimes useful to be able to avoid redrawing the layers in each new view; this is especially useful when the user has background rasters and wants to focus the display on an area of some raster. With this option enabled, it is possible to hold down the "Shift" key (not "Caps Lock.") to prevent vectors from being redrawn on each new view. In this case it will be useful to execute "Redraw (F5)" when the user decides at the end; this way the user gets back all the layers that they didn't let redraw during the process. Interrupt selection redraw with Shift It allows to avoid the drawing of the selections (raster or vector), which is useful when the user wants to speed up the drawing because there are scrolling, zooming, etc. Unlike the option that allows the user to interrupt the drawing of vectors and WMS layers with the shift key (previous paragraph), this option allows to avoid drawing vectors and instead draw selections or, conversely, prevent drawing selections but allow vectors and WMS layers to be drawn. Some graphic boards or printers fail in the attempt to draw very complex objects (for example lines of 20000 vertexes). The problem can get worse in the cases of polygons and thick lines. The problem also depends on scale and the detail of the output device (normally in a more detailed scale or in a device with higher resolution, more probability of problems) and of the "quantity" of the object visualized or printed: the general view of an object has the most probability of problems, especially on screens or in printers with high resolution or on large format paper. The parameters 'MaxVertexsTargetaGrafica' and 'MaxVertexsImpressora' allow you to define the limit value for your equipment. If an object goes over it, MiraMon simplifies it with an intelligent algorithm that normally does not cause undesired aesthetic effects. If on your screen or your printer a particular object is not drawn, lower the value of this parameter until the object is drawn. A value between 10000 and 15000 is usually adequate for most devises, but you can make a finer adjustment empirically as these parameters can be changed from the MiraMon menus (this is also useful when you select a different printer from the automatic one). In the same way, and because calculating the simplification is complex and can cause the redrawing to be too slow, you can make MiraMon not draw the objects that reach this level of complexity by setting the parameter 'DibuixaObjectesComplexos' to 0. This way, you can work with polygons of, for example, 50000 vertexes, without redrawing them in the views that need a number of vertexes higher than 'MaxVertexsTargetaGrafica' and 'MaxVertexsImpressora' and therefore obtain faster redrawings. When you want to print, simply activate "Visualization | Special | Draw complex objects" again. The possible values are: 0=No, Do not draw complex objects 1=Sí, Draw complex objects It activates an acoustic signal when the client area is not correctly updated. It will usually be turned off, but you can activate it during the session through this menu using "View | Special - > Warn if redrawing error" " or using the key "AvisaErrorRed" of the MiraMon.par file. AvisaErrorRed=0,Deactivate the acoustic signal AvisaErrorRed=1, Activate the acoustic signal Ignore changes in file attributes During a MiraMon session, the program controls the integrity of the open files each time a redrawing or query by location or by attributes occurs. This way, if some other program running in the background or some other user of your network modifies the open files, you will be informed about this and you will have the chance to reload it from the disk (if you do not wish to let anybody modify your files, write protect them or configure properly the access to your directories from the network). This option is deactivated automatically. You can activate it through "View | Special - > Ignore changes in file attributes" or through the parameter "IgnorarCanvisAtributsHoraDataMida" of the MiraMon.par file. Moreover, if this option is activated, MiraMon will not detect if a change has been produced in the graphic files or in the database tables during the work session (for example because another user has modified a DBF or because we are reconstructing the topology) and this can cause the program not to work properly. In Windows 9x and NT this option has to be set at 0 to guarantee optimum functioning of the program (that is, it will detect any change in the files in which you are working). IgnorarCanvisAtributsHoraDataMida=0, Does not ignore the changes of the attribute IgnorarCanvisAtributsHoraDataMida=1, Ignores the changes of the attribute Informs about the need of reload of modified files... In case a file is modified by another program in background or by another network user, it is possible to choose different options regarding the file uploading and notification about the change:
Mantain current view when opening a new map or a new layer This allows you to keep the current view when you open a new layer or map. This parameter, which has a value of 0 (false) automatically, acts by inhibiting the reading of the section [VISTA] when a layer is already loaded (remember that this section indicates the coordinates or layer in which the loaded view is centred automatically). Its value can be modified from the menu "View | Special - > Mantain current view when opening a new map " or using the parameter "MantenirVistaActualEnObrirNovaCapa" of the MiraMon.par file. MantenirVistaActualEnObrirNovaCapa=0, Does not mantain the current view when a new layer is opened MantenirVistaActualEnObrirNovaCapa=1, Mantains the current view when a new layer is opened Allows, when zoomed to a selection, to "air" around the selected objects instead of showing them fitted to the top and left sides. The default value is 1 (no air) and can be decreased to 0.5 (only the central half of the screen is used). Its value can be modified from the menu "View | Special | Center selection in window or through the parameter CentraSeleccio in the file MiraMon.par CentraSeleccio=0, It does not center the selection, it snaps it to the top left side CentraSeleccio=1, Centers the selection on the screen Percentage of the window occupied by the selection... Allows the user to select, when the selection is zoomed, the percentage of the viewport that is occupied by the selected object or objects. The maximum value (and default) is 100% and the minimum value is 50%, although it can be modified from the menu "View | Special | Percentage of the window occupied by the selection..." or through the parameter PercentPantallaSeleccio from the file MiraMon.par. PercentPantallaSeleccio=1, The selection takes up 100% of the screen PercentPantallaSeleccio=.5 The selection takes up 50% of the screen Scale affects visualization of the selected objects When the display of a layer is limited to a certain scale range and a selection of objects is made in that layer, this option allows to choose whether to display the selected objects when the zoom level is outside the range of view scales defined. The default value (0) keeps objects selected at all display scales. However, the mode can be changed if someone really wants to see selected objects disappear when the scale makes "normal" (unselected) items disappear as well, by enabling the menu option "View | Special | Scale affects the display of the selected objects" or through the parameter EscalaApagaObjectesSeleccionats of the MiraMon.par file: EscalaApagaObjectesSeleccionats=0, the display of selected objects is maintained regardless of the display scale EscalaApagaObjectesSeleccionats=1, selected objects are hidden based on the defined display scale range This is usually useful to keep the selected objects and see where they are, even if at that particular zoom (scale) the user does not want to see the rest of the objects of the layer; this is especially useful to avoid silly situations like losing selected objects when the view scope is an overview; that's why the default mode is that the scale does NOT turn off the selected objects. Exhaustive test of Graphic Id. field when opening dataset This allows controlling whether, in reference to the GraphicId field, an exhaustive analysis of its content and coherence is carried out or if a quick analysis is carried out that only checks the presence of multiple records or additional records with negative indices or greater than the number of objects. Given that the vast majority of layers have a correct GraphicId field (ordered in ascending order, etc.) the default option applied by MiraMon is not to carry out an exhaustive analysis of the GraphicId field, to avoid delaying the reading of the layers. However, in order to test layers that exhibit strange behavior, the user can open the program in Exhaustive test mode, as well as temporarily change the behavior within a session via "View | Special | Exhaustive test of GraphicId field when opening dataset". TestIdGr=2, an exhaustive analysis of the content and coherence will be carried out in relation to the GraphicId field TestIdGr=1, the presence of multiple records or additional records with negative indices or greater than the number of objects in relation to the GraphicId field is checked Si es desitja fer el canvi de manera permanent, es pot activar la casella Test exhaustiu del camp IdGrafic al Menú Ajuda | Paràmetres de configuració del MiraMon | Zoom i Aspectes generals o bé indicant a través del MiraMon.par el paràmetre TestIdGr=2. Zoom over raster files can be controlled by MiraMon or by Windows. We advise the former option, usually faster and less problematic, specially with large files. MiraMon is able to control zoom operations for all kinds of IMG files and for almost all BMP files; nevertheless, if you load some BMP file with an unsupported format, the program automatically gives the management to Windows. Similarly, if MiraMon has the zoom management and some redrawing error occurs, the program automatically passes the control to Windows, although this is normally no solution, specially if the problem involves the graphic board driver. The parameter "GestZoom" from the MiraMon.par file allows you to define who (MiraMon or Windows) will automatically manage raster zoom operations. GestZoom=MiraMon, The zoom is managed by MiraMon GestZoom=Windows, The zoom is managed by Window For more information on using zoom in raster and vector files, see Zoom Menu. File memory management In order to improve the speed of first loading and redrawing based on the user's needs and the configuration of their computer equipment (amount of RAM, free space on the disk where temporary files are located (typically the C: drive), speed of their network, etc.), a fine-tuning mechanism has been established for the management of the memory required by the three main types of layers that we open: rasters, vectors and WMS layers. The "View | Special | Required file Memory management" dialog box allows you to dynamically change the memory management specifications that we will indicate below, which can also be initially established from del MiraMon.par 
Image enhancementIt allows you to make linear expansion of the contrast in 8-bit and 24-bit images (RGB). The user can select the level of saturation in each histogram tail as well as exclude the zero in the calculating process (useful if there is a background with this value). If you indicate a saturation level of 0 in the two histogram tails, the maximum and minimum values are resized to [0, 255]. For restoring the original appearance select Restore original. From this dialog box you can indicate an independent saturation percentage for each of the tails (lower or higher) of each of the 3 histograms. This option usually provides much better quality of the final visualization, but some zones of very high or very low reflectance can become burnt or black. Automatically MiraMon offers the possibility of saturating the histogram tails (higher and lower) in 1.5%. For more information consult Image enhancement of the File Menu.   MiraMon maps (MMM files) store the applied image enhancement parameters. When you reopen the map, rasters are enhanced as they were before saving. Notes: * The first time the process is slower because the histogram is calculated. * On 24-bit images all processes are slower because changes are made to the image values, not to the palette. Modify layer order and propertiesAllows you to change the (vertical) order managing the display of the layers. It also allows you to change the properties for a layer or group of layers. 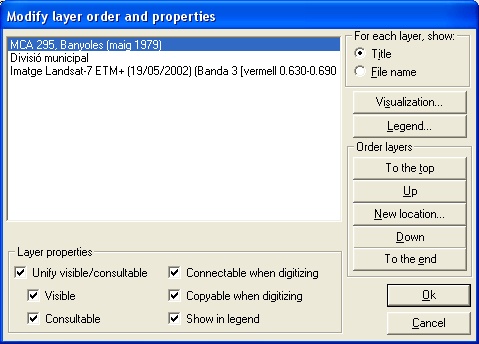 The dialog box "Modify layer order and properties" shows, in the main window, the layers that are open in the current MiraMon session. These layers can be displayed by title or by file name. To modify the properties of a layer (either of the visualization or in the legend), this would have to be selected (it appears highlighted in blue). The "Visualization" button allows you to change the general properties of visualization for a given layer. For example, it allows you to change the palette with which we are displaying a file (in MiraMon, each file, either raster or vector, can be associated with a different color palette). For vector files it is also possible to change the color from "constant" to "indexed by palette" or vice versa, to change the constant color, to choose different database fields as texts (PNT files), or as indices to the palette colors (ARC or POL files), line widths, etc. Any decision make when opening the file and affecting the viewing properties can now be modified. The "Save" button on the dialog box allows you to save the current options as default options for this file; this is accomplished by filling or modifying the [COLOR_TEXT] section in the corresponding REL file. For more information about visualitzation, consult MiraMon general visualization characteristics. The "Legend" button allows you to access, for a given layer, the viewing properties in the legend. In the dialog box "Visualization of the layer in the legend" you can choose various options such as, for example, the number of categories to be displayed, the value index of the elements to be displayed, etc. This dialog box also allows you to reorder the layers that you have open, placing them in a level that is up/down, to the top/end, or below the layer that you indicate (if you push the button "New location"). 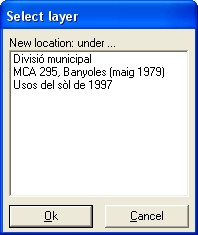 MiraMon allows some changes in the layer properties. MiraMon allows a layer to be:
The activation of the first two properties of a layer or group of layers can be tied in parallel by activating "Unify visible/consultable". This is often useful because, in many cases, if a layer becomes non-visible we will not wish to consult it. The "Consultable" attribute affects queries by location and by attributes. The options "Connectable when digitizing" and "Copyable when digitizing" are useful because they avoid a visible layer, used as a visual reference while digitizing, to be used as a snap point or to be used as a source of graphic objects to be copied from it. In the case of raster files, these options are not visible given that they are not options that can be applied to these formats. The option "Show in legend" allows you to visualize the layer in the client window or, if not, in the legend. Change color/symbol from palette/symbolization tableIt allows you to change any color from any loaded palette (attached to raster or vector files). First you have to select the palette or color table to modify. 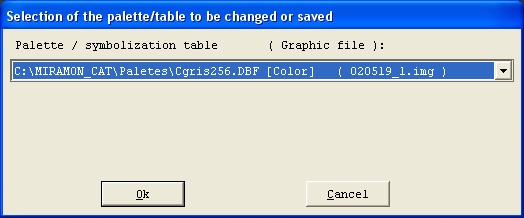 Changes are made through an edit color box. Note that you can select a range of values (for instance, 12,17 to indicate from color 12 to 17, both included: [12,17]) on which you want to apply the same new color. This allows a fast visual emulation of the results obtained through the Reclassify (RECL) function of the MiraMon Calculator ("Tools | Calculator...") on byte files. Nevertheless, for that purpose you will usually use the "Query by attributes (where is ...)" function of the Information menu. 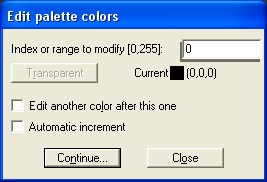 If you push the button "Continue", you will access the color editing window, which allows you to choose between 48 colors previously defined by the system (Windows) as well as define up to 16 customized colors (from 16 million possible colors) which will be preserved until the end of the session. You can also define the colors with RGB, HLS values or graphically. Colors which appear with dithering only remain equal inside the polygons, but not on the lines or on the polygon's outlines. In this case, color is simplified to the nearest solid color; computers with a graphic board able to show several thousand or million colors do not have this limitation (colors are solid, not dithered). Raster files always use solid colors. When editing color palettes, the "Categories..." button allows you to view the categories associated with each color. These categories are the raster legend entries (REL file), or the values of a field of a table of the database and/or ranges of numeric values that MiraMon scales to fit the color indices (raster cell values, numeric database fields) in the number of colors the current palette has. To facilitate the process of editing the colors of the palette you can check in "Edit another color after this one". So, after displaying each new color change, you will return to the dialog box to continue editing the palette colors. You can also activate the appropriate checkbox to produce an automatic increment of the color index to edit each time you return. MiraMon comes with a file (256C.IMG, located in the MiraMon directory) that is ideal for editing color palettes. Open it with the appropriate palette (or with a default 256 grey levels palette), display the legend (F11) and edit each color index. If a vector file has been loaded through "constant color", it will not appear in the list of possible changes. In this case you should go to "View | Modify layer order and properties". For more information consult Color symbolization tables in the MiraMon symbolization tables description. Selection colorIt allows you to change the highlighting procedure and color when querying by location in vector layers and when querying by attribute in either raster or vector layers. Choosing "MiraMon", the selection color will be red for raster layers and optimized by MiraMon depending on the original color for vector entities; in this case, MiraMon uses an algorithm that creates colors that are very different from the original ones and that avoid confusions with the background color. Choosing "Constant", the selection color will always be a constant color that will be selected by the user from an edit color box. The default applying when the program starts can be set through the parameter "ColorSeleccio" from the MiraMon.par file. If you wish MiraMon optimizes the color for selection by setting: ColorSeleccio=(-1,-1,-1) However, you should set any valid (R,G,B) color to establish a constant color for selected entities; remember that ranges are limited to [0,255] for each color component. For example, to obtain selections in red set: ColorSeleccio= (255,0,0) To obtain selections in white set: ColorSeleccio= (255,255,255) Background colorIt allows you to change the background color of the client area (useful with certain rasters and with vectors without rasters). This option can be set by default by using the "ColorFonsInit" parameter of the MiraMon.par file. The value to use follows the following rule: 41 = White -> (R,G,B) = (255,255,255) 42 = Light gray-> (R,G,B) = (192,192,192) 43 = Gray -> (R,G,B) = (128,128,128) 44 = Dark gray -> (R,G,B) = ( 64, 64, 64) 45 = Black -> (R,G,B) = ( 0, 0, 0) Predefined background colors belong to the Windows palette, but they could be different if some external application activates (which is very rare) the option of using all the colors of the palette. Then, only black and white colors remain perfectly guaranteed. Reference gridThis option allows you to draw a reference grid according to the reference system currently used (UTM, etc). 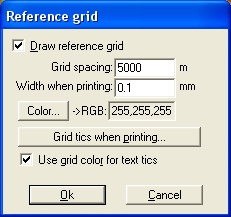 To set the grid spacing, simply type it in reference system units. MiraMon draws the first grid line on the first multiple of the grid spacing; for example, if a map starts on the UTMx coordinate 450728 and you enter a grid spacing of 1000 m, the first vertical line will be drawn on coordinate UTMx 451000. The reference grid is printed with the map if you have indicated to do so. You can choose the thickness of the reference grid that you want when you print it. If you press the button "Color" you will access the color editing window, which allows you to choose between 48 colors predefined by the system (Windows) or define up to 16 personalized colors (between 16 million possible colors) that will be conserved until the end of the session for visualizing the reference grid. To switch off the reference grid, deactivate the box "Draw the reference grid". This way you can, when printing, only show the grid ticks and texts but not the grid itself. A value of 0 in the grid spacing also indicates no grid, but then there is no possibility of grid ticks and texts. The "Grid tics when printing..." allows indicating which tics to print, as well as the font (including color), divisor, etc. 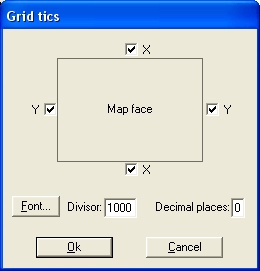 Note that you have the button "Use grid color for text tics" when you accept the box "Reference grid", the font color will be overwritten by the grid color. Print dialog boxes also allow indicating if you wish the corresponding ticks and numbers on some side of the map face. All the related parameters (font, etc) can be stored when you save a MiraMon Map. Meridians and parallels graticuleThis option allows you to draw a reference grid according to meridians and parallels (graticule). 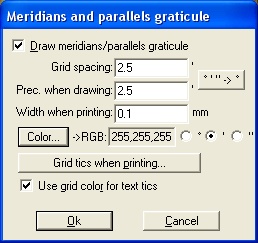 In a similar way to the "Reference grid", you can choose to draw the meridian and parallel grid in the units you wish (degrees, minutes or seconds, depending on the scale of your map), defining the precision when drawing (if it is zero, you use the knots of the grid), the thickness when printing and the color of the meridian and parallel grid. The units in which you want to define the meridian and parallel grid are degrees, minutes or seconds. You can select one of these units with the button 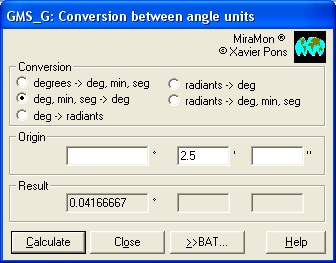 The button "Grid tics when printing..." allows you to indicate which grid tics to print, such as the font (types of script, font color, size, etc), divider, and decimal numbers, in a similar way to the reference grid. Note that if you have the "Use grid color for text tics" activated when you accept the box "Reference grid", the color of the font is defined by the color of the grid. In the printing dialog boxes you can also indicate if you want the corresponding marks and numeration on the edges of the field of the map. |