Title bar
In the main window of
the program you can see, at the top, the title bar. In order to decide the text of the title bar for each MiraMon session,
the program uses the following rules:
- If you
have one or more maps loaded, the first one (low level) will be reported
in the title bar.
- If no
maps are present, the same logic is applied to raster
files.
- If you
only have vector files, also the first one will provide the title
bar.
In all cases (MMM, raster and vector files, geoservices), if the file or the capabilities description contains a descriptive title ([DOCUMENT]
section of the MMM, DatasetTitle field of REL file for structured vectors,
FileTitle field of DVC file for non-structured vectors, etc), it will be
used instead of the file name. The only exception are RGB composites,
which, for the sake of the limited space of the title bar, show the three
IMG file names used instead of the three titles; if you wish to give a title for
some RGB composite, store it into a MMM and give the appropriate title to
the map when saving it.
MiraMon menus
Below the title bar the different menus of MiraMon are found. By default, MiraMon displays the menus File, Edit, View,, Zoom, Info, Tools and Help, although it is possible to create a custom menu settings via "Menus" tab in the "Help | Configure Parameters" menu which involves increasing or decreasing the functionality of each menu.
Each MiraMon menu allows access to specific functionalities (open files, digitize, etc.). When an asterisk ('*') is displayed next to a menu function, it indicates that the function is
implemented in an external module. This fact implies:
* The files involved do not need to be opened from MiraMon.
* A process can be started and let it running in the background
while working with MiraMon or other application, because
MiraMon automatically launches these processes in multitasking.
* The running parameters can be introduced from the command line. So
BAT files to do repetitive tasks can be written.
* The running parameters can be introduced in Windows dialog boxes
even when running in DOS boxes. Simply the program name
preceded by the letter "W" must be executed. For example, to execute CreaTop, type wCreaTop and the CreaTop's
Windows interface will appear. If the computer is under Windows 9x or NT, the "W" programs can be started directly from the command
line.
* To obtain more complete help for any of these modules, the
MiraMon menu and the "Help" button on the parameters
dialog box can be consulted. To get help from the command line the program name
followed by a question mark (CreaTop
?) must be taped; if no question mark is given, the syntax without
help will be shown.
Buttons toolbar
Below the MiraMon menus a set of
icons named buttons toolbar is shown.
If you put the cursor on
an icon you can read its function description. The icons are grouped into
functional groups.
-
The first five icons
 correspond to icons related to the administration of files (open favourites, open (and also open RGB and close through special keys), open recent, save map and print, respectively). correspond to icons related to the administration of files (open favourites, open (and also open RGB and close through special keys), open recent, save map and print, respectively).
From MiraMon v.7 on, the program's own presentation box offers a new method to easily open typical maps (topographic, orthophotos, land cover maps, protected areas, ) organized in different themes or regions, and that constitute favorite collections. These collections also help the user from the beginning with the location on the map.
On the left of the presentation ("about") area, there are a series of maps that are part of a collection of favorite maps, for example, the one of the "Typical Maps of Catalonia". If the program does not detect the existence of collections of favorite maps installed, in the corresponding space an HTML dropdown menu appears with the examples of collections of favorite maps that can be downloaded from the MiraMon web (currently the collections of Catalonia, Andorra, Spain, the Iberian Peninsula, Argentina, Paraguay and the world are distributed as examples) in case the user wants to download the ones that are offered by default with the program. If you do not have access to the Internet at that time, the web address where the collections are located is written so that it can be copied to download later or from another computer that does have a connection on the Internet. For more information, see MiraMon Favorite Map Collections.
In the favorite collections window (also in the presentation of the program) the MiraMon Twitter information is also offered, all the information of the
MiraMon Versions Diary and the MiraMon Users Forum (FUM) after a few seconds of opening the box. At the same time, if the MiraMon.par includes the code PaginaHTM_AlternativaPresentacio= it is possible to indicate an alternative HTML page on these pages and typically show corporate information (latest news on an administration intranet, guidelines for students in a classroom, etc).
To facilitate the use of the program, MiraMon defines a user profile file, not refered to the configuration (which is resolved from the individual MiraMon.par or the corporate MiraMon.par), but rather for aspects such as the last WMS layer opened or the latest collection of favorite maps used. This file is named MM_Perfil_USUARI.par (where USUARI is the user name in the system) and is located in the temporary directory (the inclusion of the user name in the file name responds to the fact that some configurations in classrooms use the same temporary directory for all users of the same computer).
The second icon allows you to open any type of file by navigating through the different folders. If the button icon is pressed at the same time as the "Ctrl" key is held, a list of all opened layers, maps, etc, will be displayed, so that you can select which ones to close; if the button icon is pressed at the same time as the "Alt" key is held the program will allow to choose, consecutively, 3 raster files to easily make an RGB composite. On the other hand, the third icon allows you to access a list of the files opened, used or created recently. The list contains several fields (name, extension, type, etc) that allows sorting by any of them. The fourth icon allows you to save the map while the last one allows accessing the print menu.
-
The second group is formed by a set of icons related to the visualization zoom
 .
The first two icons allow you to zoom in or zoom out o from the center of the image. The third icon lets you to zoom to the window that you define with the cursor. The fourth icon, represented with a hand, allows you to move the display. To do this, you will need to position the cursor over the area you want to move, and click with the left button of the mouse. When the hand closes is when you can move the dispay as much as you want. A second click redraws the mapa in the desired position. .
The first two icons allow you to zoom in or zoom out o from the center of the image. The third icon lets you to zoom to the window that you define with the cursor. The fourth icon, represented with a hand, allows you to move the display. To do this, you will need to position the cursor over the area you want to move, and click with the left button of the mouse. When the hand closes is when you can move the dispay as much as you want. A second click redraws the mapa in the desired position.
 The program switches to dynamic drag (moving the map automatically by dragging it with the mouse (like if the hand button or "pan" had been pressed or this function had been requested from the "Zoom" menu) when it detects that, after clicking with the right button (or the left button if you are left-handed and you have exchanged the buttons), an immediate drag is executed. From this moment, you can release the button and work in the traditional mode in MiraMon, continuing the dragging until a second click is made. The program switches to dynamic drag (moving the map automatically by dragging it with the mouse (like if the hand button or "pan" had been pressed or this function had been requested from the "Zoom" menu) when it detects that, after clicking with the right button (or the left button if you are left-handed and you have exchanged the buttons), an immediate drag is executed. From this moment, you can release the button and work in the traditional mode in MiraMon, continuing the dragging until a second click is made.
The lateral scroll which has been dynamically activated by dragging the mouse automatically switches to query mode when a second click is done; in fact, continue scrolling is as easy as dragging again. In the case of people with special needs, for keeping the button dragging (people with Parkinson, ), the automatic return to query mode is not done when the scroll request has been made from the menu or from the corresponding button at the button toolbar. Consequently, the "pan" mode remains activated until the zoom level is changed, or it is explicitly deactivated through the button toolbar or the menu, or after clicking the "backspace" button on the keyboard.
To avoid problems with this new function in users with mouses of different sensitivity, computers working at different speed, the option to deactivate the dynamic scroll mode (by default activated) and to set the time, in seconds (0.20 by default), that the program waits between a mouse click and a drag to consider that a dynamic change is made to scroll mode ("pan") has been added through the Help menu | Configure parameters | Zoom and General issues, also accessible through the
section [HARDWARE] of the MiraMon.par,
parameter TempsArrossegamentDinamicSegons=. You can also inactivate the dynamic change to offset with the same parameter.
Additionally, if you want to activate or deactivate the dynamic scroll mode while digitizing you can use another parameter, ActivaArrossegamentDinamicDurantDigitalitzacio=, in the same [HARDWARE] section; this parameter is useful because some people tend to "drag" the mouse between clicks during digitizing and activate the dynamic scroll very frequently.
|
Ľ The next icon's function is to
mosaic/synchronize MiraMon sessions, which allows you to visualize the windows of the sessions that you select stacked (vertically) or parallel (horizontal) and synchronize them from the session you choose. Note that to synchronize sessions correctly, the zoom management mode in all of them must be the same. Next you will find the preview icon, which allows you to return to the previous view, up to a total of 10 times. The penultimate icon, for general view, allows you to move from any zoom of view to the full view of the layer or layers. So, if you have more than one layer loaded, the display area will be the maximum possible (both X and Y) of all open layers. Lastly, the zoom to selection icon allows, once the result of a selection by attribute has been obtained (and been hold), increase the selected area to the maximum zoom that allows the screen.
The following icons, out of the group of zoom icons, correspond to the
redrawing and to the GPS data capture in real time  . The redrawing is used to update the display of layers (for example when you are digitizing vectors, ). . The redrawing is used to update the display of layers (for example when you are digitizing vectors, ).
 Use F5 to redraw, Ctr+F5 to refresh and Shift keys to stop redrawing Use F5 to redraw, Ctr+F5 to refresh and Shift keys to stop redrawing
The interruption of the redraw with the Shift key also applies to the WMS/WMTS layers and to the redrawing of vector entities (structured or not), which is practical when a WMS/WMTS or vector layer is very slow to redraw and we have an open raster in the background that can serve as a reference and we do not want to turn off the WMS/WMTS layer while looking for the area of interest. At the same time, the option "Cancel redraw of selection with Caps" in the View menu, prevents drawing of the selections (raster or vector), which is useful when we want to accelerate the drawing because we are scrolling, zooming, etc. For more information see Visualization | Special.
Visualitzaciˇ |
Especial.
|
- The second icon of the group, for capturing GPS data in real time, allows access to the
reading of GPS/GNSS data from MiraMon if your receiver sends data to the computer using the NMEA protocol.
-
The next group of icons corresponds to those that allow to query on the loaded layers and to create annotations
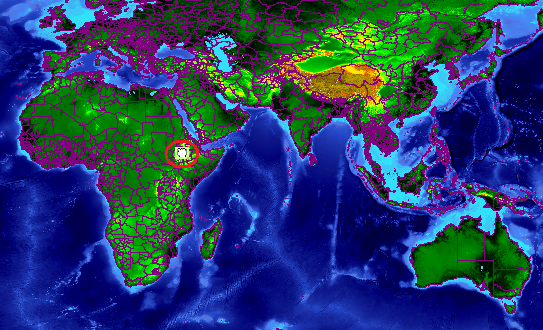
 . Thus, the first icon allows to query by location. Once you click this icon, you can query any point to obtain the available information about that point. . Thus, the first icon allows to query by location. Once you click this icon, you can query any point to obtain the available information about that point.
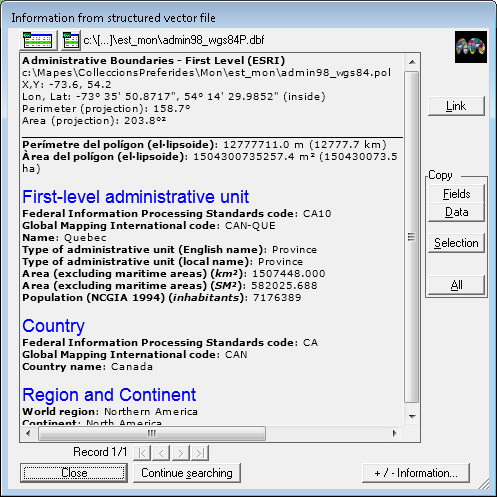
 In the queries by location, MiraMon uses HTML resources. This allows you to have the typical functionalities of Internet browsers: see source code, select a text and convert it to PDF, etc. Therefore, if the associated alphanumeric database, or even the separators between fields contain HTML code, this is interpreted exactly as in an Internet browser. The applications of this feature are very diverse and broaden considerably the already rich query by location information in MiraMon (which also has configurable text sizes in the separators, colors, showing the right units from metadata in table fields or in raster layers, ) with possibilities such as embedding an image in the query (it is enough that the field, that you can declare as hyperlink to the image, be also declared as embedded content and then MiraMon will draw the image in the query by location box).
|
In addition, MiraMon incorporates the function of informative pop ups or tooltips in both raster and vector layers, so that it can be indicated that a layer content appear in the form of a text pop up by placing the mouse over an entity or position To activate this feature, click the button  on the layer's display window. When informative tooltips are asked for more than one layer, the contents are shown stacked in a single tooltip. If a layer is classified as not queryable, the informational tooltip do not appear (but keep in mind that you can assign it as not visible and, therefore, you can have "background" layers, which do not consume redraw resources or appear in the layout but provide values when placing the cursor over them). On the other hand, informative tooltips show the corresponding units, provided that the value has units and metadata indicate that it is desired to show the units, both in raster (also multi-band) and in vectors. In the case of rasters, the information in the pixel appears in the form of a text tooltip that shows the DN in a remote sensing image, the altitude value in an DEM or the category in a discrete raster linked to a thesaurus. on the layer's display window. When informative tooltips are asked for more than one layer, the contents are shown stacked in a single tooltip. If a layer is classified as not queryable, the informational tooltip do not appear (but keep in mind that you can assign it as not visible and, therefore, you can have "background" layers, which do not consume redraw resources or appear in the layout but provide values when placing the cursor over them). On the other hand, informative tooltips show the corresponding units, provided that the value has units and metadata indicate that it is desired to show the units, both in raster (also multi-band) and in vectors. In the case of rasters, the information in the pixel appears in the form of a text tooltip that shows the DN in a remote sensing image, the altitude value in an DEM or the category in a discrete raster linked to a thesaurus.
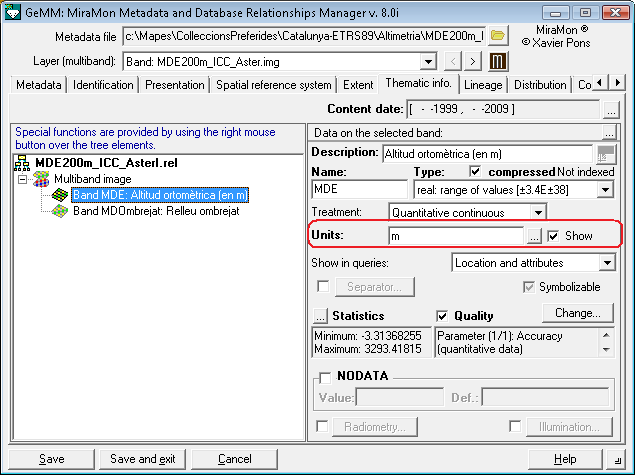 Ľ The following picture shows a DEM, a municipal boundary colored by region and a habitat map (which is not displayed because it has been indicated that it is not visible), to which it has been requested that both the raster value of the DEM (altitude in meters), the field of the vector database that provides the name of the municipality as the habitat be shown in the informative tooltip. Note that tooltips can also be limited by scale in each layer of information.
Within the group of icons that allow queries on the loaded layers, the second icon corresponds to the selection of objects, an icon that allows access to the box objects interactive selection. The third icon corresponds to the query by attribute. By clicking on it, you will access the "Query by attribute" box from which you can perform the query. The fourth icon of this group corresponds to that of measuring distances, perimeter, areas, etc. Once you click on the icon, the distance measurement box will appear. If you want to measure a distance, simply click on the two points you want to know the distance between them. MiraMon allows you to do this query repeatedly, so that it provides the distance from the last clicked point (that is, the last segment) as well as the total length. If you click on the "Area and perimeter" button, MiraMon will perform the query on the polygon resulting to draw a new segment from the last defined vertex to the first one.
The following icon  allows to insert annotations on a map by adding points (with or without anchored text), lines or polygons, which can be modified, deleted and can be saved in maps. For further information, see Create Annotations. allows to insert annotations on a map by adding points (with or without anchored text), lines or polygons, which can be modified, deleted and can be saved in maps. For further information, see Create Annotations.
The penultimate group corresponds to the layers management icons  . In particular through the first icon it is possible to change the order and properties of the layers. The second icon allows to show or hide the legend while the last icon allows you to edit the metadata of the file you select (in case you have more than one open). . In particular through the first icon it is possible to change the order and properties of the layers. The second icon allows to show or hide the legend while the last icon allows you to edit the metadata of the file you select (in case you have more than one open).
 In the tutorial Visualitzaciˇ de mapes i ordre de capes (authorship: Oscar Alemßn; original audio: Catalan) it is explained how to establish the order and display properties of rasters and vectors. In the tutorial Visualitzaciˇ de mapes i ordre de capes (authorship: Oscar Alemßn; original audio: Catalan) it is explained how to establish the order and display properties of rasters and vectors.

Regarding the initial look of the program window, you can always show it maximized from the beggin with the "MaxIni=" parameter in the MiraMon.par file. In addition, the button toolbar can be hiden through the option "View | Environment | Show tool bar" or from the " MostrarBarraBotons=" parameter in the MiraMon.par file.
|
The last icon, available only for certain licenses of MiraMon Profesional as those of the Public Administration, Universities, corresponds to the open data publisher  , an icon that allows, from a vector or a map, to generate an MMZX or an MMZ (certified or not) and/or one or several SHP files with the symbolization in one or more files that follow the OGC v.1.0 SLD standard and one or more XML files with metadata in ISO19139 format. , an icon that allows, from a vector or a map, to generate an MMZX or an MMZ (certified or not) and/or one or several SHP files with the symbolization in one or more files that follow the OGC v.1.0 SLD standard and one or more XML files with metadata in ISO19139 format.
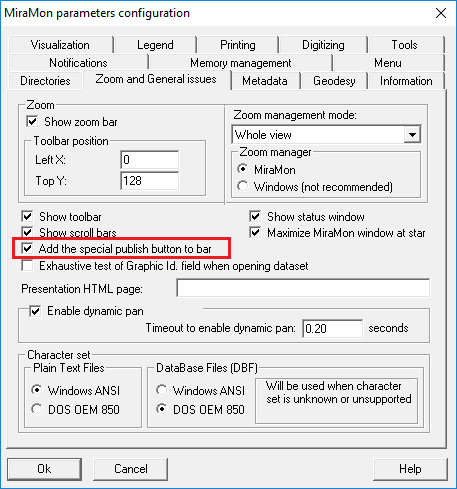
In order to display this button on the buttons toolbar, you must indicate it in the MiraMon.par via the BarraBotonsEspecial= key in the [MiraMon] section. This key can be 0 or 1. If 1 is indicated, the special button bar that includes the additional button that allows the publication/export of MiraMon vector maps is shown. If 0 is indicated, the special button bar is not shown; this is the default value. It can also be configured through the Help menu | Configure parameters | Zoom and General issues, with the activation of the check box "Add the special publish button to bar".
Clicking the button opens a window that allows you to select one of the open layers (vector or a Map) or a file and to indicate if you want to generate an MMZX, MMZ, SHP, etc. The window has an area where the messages are displayed as the files are generated, so in case there are gaps in the metadata, they are written so that the user can copy the messages and correct them. This option can also be called from the command line: MM32 can be called with these parameters:
/PUBLICMM indicates that some of the layers to be opened are to be published
/MMZ=NomFitxerMMZ indicates the name of the MMZ or MMZX to be generated. 'NomFitxerMMZ' is the path and name of the MMZ to be generated.
/SHP=NomFitxerSHP indicates the name of the SHP file to be created.
/XML19139 indicates that metadata will be exported with ISO 19139 format. This option is only available if /SHP= has been selected.
/SLD indicates that symbolization will be generated according to Styled Layer Description format version 1, from OGC. This option is only available if /SHP= has been selected.
Bottom bar
In the bottom bar of the main window of the
MiraMon the coordinates for the point where the cursor is located (in the reference system of the cartographic composition being displayed, if any) and the display color (RGB composition) is documented; the numerical scale and the graphical scale (if any) corresponding to the display of the composition are also documented.
By clicking on the scale, the user can set the desired display scale.

MiraMon displays, by
defect, a valid query cursor either for rasters or for vectors. By using
the F9 key you can change between the three cursors
types:
 |
 |
 |
| Raster/vector query |
Only raster query |
Only vector query |
However, according to
the function that the program is developing, the cursor will change to a
shape that is different from the ones shown above.
|
 |
  |
 |
 |
 |
| Move nodes |
Pan |
Hyperlink to open a file, internet resource etc. |
Change the attribute by dragging an attribute from the
legend |
Create annotations |

Starting with version 6, MiraMon can open several rasters at the same time. Rasters can be ordered in a juxtaposed and/or superimposed manner and in any disposition, regardless of its extent, pixel size, number of bits per pixel, etc. In addition, unlike previous versions, rasters no longer condition the extent of open layers, which, nevertheless, can be controlled appropriately from "Zoom | Define new general view...". At the same time, the number of open raster and their location in the superposition with respect to the vector layers and geoservices (WMS, etc) is totally free.
For raster visualization, the following zoom management modes are available:
-
Whole view mode: This is the most intuitive or natural zoom mode, which is the default mode and recommended to generalist GIS users, but it will not provide you with the highest quality display in a group of rasters with the same pixel size. In it, the zooms are defined considering that the whole zoom view corresponds to the entire extent of all layers or to the one specified in "Zoom | Define a new whole view".
-
Raster Mode: In this mode, a specific raster, which we name the "Reference Raster ", has the Zoom=1. This is especially useful in Remote Sensing, where often a very strict control of which pixel we are working on, and to make scrolls exactly pixel by pixel is needed, as well as having an optimal viewing of the raster quality at zoom=1. In case of choosing the Reference Raster mode, we will have to indicate which of the open raster is the one of reference, that is to say, which one has the pixels that we want to assign to the level of zoom=1.
-
Automatic mode: This mode applies the Reference Raster mode if all the open rasters have the same pixel size; otherwise it applies the Whole view mode, or when there is no raster loaded. It has the advantage of providing the highest visual quality if we are opening several rasters with the same pixel size but, in case you have an open raster, the x15 limit in Raster mode.
We recommend that you carefully read the information regarding the zoom management mode of the Zoom menu.
The list of rasters that MiraMon can open directly includes: *.img; *.jpg; *.jp2; *.jpc; *.j2c; *.sid; *.tif; *.ecw; *.bmp; *.rle; *.dib. The mechanisms to open directly are: from the "File | Open" menu, or "File | Open raster", dragging them onto the application (drag & drop), double-clicking on the file in the Windows Explorer, launching them from the command line (MM32 [ROUTE]FILENAME.EXT), or linking them as hyperlinks to the databases and opening them from boxes of query by location. For more information, see Open raster on the File menu.
When you open a raster to be displayed, you simply have to choose the appropriate color palette, unless it has already been specified in the REL file that accompanies the raster, or that it is a raster with a palette embedded, as in some TIFF files. In addition, in the "Modify layer order and properties" dialog box you can also define the layer to be visible and/or queryable, both on the screen and in the legend.

If you open the vector on top of other vectors, the total zoom extent is the result of the sum of all extents. If you have an open raster, or if you open it later, the priority with regard to zoom levels and display window will depend on the selected zoom mode. We recommend that you carefully read the information regarding zoom management mode of the Zoom menu as well as the synoptic zoom management information explained above, in Raster view.
Directly, either from the "File | Open" or "File | Open Vector" menu, dragging them onto the application, double-clicking the file in the Windows Explorer or launching them from the command line (MM32 [ROUTE]FILENAME.EXT), the list that MiraMon can open directly includes *.pnt; *.arc; *.nod; *.pol; *.vec; *.shp; *.dxf; *.gpx; *.kml; *.dgn; *.gml.
In non-structured vectors of polygon type, any polygon that is surrounded by another polygon will be "covered" by the surrounding polygon if it appears, in the layer, at a later position and the defined view is filling the interior of polygons. In the same way, a "transparent hole" cannot be represented. These problems do not occur if you work with topologically structured vectors.
When you open a vector
file, MiraMon offers several options in relation to
visualization.
Visualization of point vectors:
Regarding point files
(structured or non-structured vector files) MiraMon offers several options
with respect to the point radius, the scale intervals you want to show the
file in, the information to be shown if you activate the information tooltips, the iconic symbology and the font type used in texts (these last two
cases are only applicable to structured vectors), the transparency of the layer, etc.
MiraMon activates the
box "Show texts", that allows you to view texts at the
upper right corner of the point. If it is a structured vector, the text is
taken from a field of the associated database (attribute, graphic
identifier, etc). On the other hand, if it is a non-structured vector, the
text corresponds to the object attribute. You can modify the text format
(in the case of structured vectors) if you click on
"Font...". For more information, consult "MiraMon symbolization tables".
The default
radius of these points is given by "RadiPnt" parameter in
the MiraMon.par file and can be changed through the proper box: a 0 value
does not allow the point to be displayed, while 1 or 2 values are adequate
in most cases. When opening point files you can also choose to represent
the radius as a function of some database field. This is useful, for
example, to represent data as the population of municipalities represented
by points, or to represent the canopy coverage obtained in a forestry
inventory. In this case you should indicate the database field to use as
well as the minimum and maximum radii to scale the
display.
If you activate the tooltips, each time the cursor is located on the point, a floating pop up will appear with the information of the field that has been selected to be displayed.
MiraMon allows you to
use symbols to represent point structured vectors. If you do not
select this option, MiraMon will show the points as a white circle with a
black outline. Using the "Symbology" option, you can
select several options for the symbols. For more information, consult
Symbols symbolization
table.
It also allows to indicate the degree of transparency of the point (both symbol and text) in percentage, with values ranging from 0 to 100 %.
Visualization of line/arc vectors:
With ARC vectors,
MiraMon provides several options in relation to the color lines, the arc
direction, the type and the thickness of the lines.
MiraMon allows you to choose the type of line (single lines or combined lines), the color of lines and arcs which can be constant or indexed. In the case of topologically structured vectors, color setting may be done from any field in the associated database and its treatment may be Categorical or Quantitative. Using the Advanced button you will access various options in relation to the color gradation, number and range of the desired symbols, etc. For more information, see Color symbolization tables and Types of symbolization: constant for the entire layer or based on a field of the database.
When the symbolization is automatic, the option Existing! is enabled which indicates MiraMon to perform an analysis to include in the automatically generated table (and, therefore, in the legend) only those elements that actually exist in the layer, regardless of whether the field of a linked table contains them. This option is useful when making clips or selections of a layer that we symbolize from a field in a linked table when we want all the elements of the field not to appear but only those that are really present in the layer; for example, perhaps the field has the county names of a county dictionary but our layer only contains 5 of the 42 possible counties. In the case of numeric fields the effect is to restrict the values to be used to those used by graphic objects.
It also allows to indicate the degree of transparency of the lines, in percentage, with values between 0 and 100 %.
If you need to know where are the vertices of the vectors, you simply activate the
"Show vertices" box.
If you need to know the
direction in which the vector has been digitized, you simply activate the
"Show direction" checkbox. MiraMon will show an arrow that is
the same color as the line, indicating the digitalization
direction. In addition, you can indicate size, semiangle of opening, notch, etc.
As in the case of point type vectors, MiraMon allows you to activate the option of displaying line information through tooltips when the cursor stops over a line.
Additionally, any field of any table in the database linked to an arc file or any attribute of a line VEC file can be shown as a linear text next to the line using the Labelling button. This functionality also allows setting the range of scales in which you can display the texts of the lines (regardless of the scale range in the layer itself and highly recommended to avoid an excessive amount of texts in general views), as well as to censure texts of an excessive length in relation to the corresponding arc/line, etc. For more information, see Dynamic labelling of arc and line files of the symbolization in MiraMon.
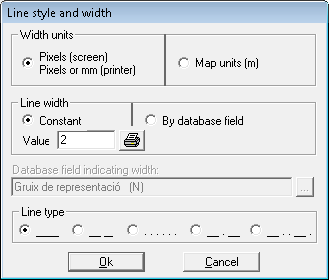
MiraMon also allows you
to indicate widths and styles of the
lines of the files types ARC and type POL. Supported styles for lines are:
solid, dotted, dashed and two combinations of dashes and dots. Regarding
widths, they can be indicated in map units or in pixels. In the former
case the displayed width will be different according to the viewing scale
(zoom level); a typical utility is to draw the nominal widths of different
communication infrastructures (for example forest tracks of 2 m, small
roads of 5 m, etc). In the second case (pixels), width is always the same,
regardless the zoom level; it is used to represent lines of undefined
width, as contour lines, administrative and property limits, etc. Widths
can be constant for all arcs/lines on the file or they can be indexed by a
database field. Lines of thickness greater than 2 pixels in the output device (screen, printer) can present any of the possible types (continuous, dashed, ).
Through the  button it is possible to define the thickness of the lines, point radius, , in the printing: automatic thickness, defining the thickness of each pixel on screen in paper units or through a user defined exaggeration factor. button it is possible to define the thickness of the lines, point radius, , in the printing: automatic thickness, defining the thickness of each pixel on screen in paper units or through a user defined exaggeration factor.
This button is only accessible if it has been indicated that the thickness, radius, are desired in units "pixels/mm", but not if it is indicated in map units, since it would not make sense. This functionality applies both to constant thickness, radius, etc, and to "by field of the database" cases.
-
If automatic is choosen, the thickness of the lines in the print will be similar to what you see on the screen (What You See Is What You Get). In this case MiraMon will exaggerate the number of pixels used in the printer so that the item is printed the same as seen on the screen. In order for it to work perfectly, the width of the screen in mm must be correctly set into the MiraMon.par file or in the corresponding configuration option (for example, in zoom by scale). This mode ignores the exaggeration factor set in the "Map | Advanced" button of the printing environment. It is the default mode in radius of points and nodes, since a point of radius 1 on the screen usually requires to be the printed with similar dimensions (the point is perfectly visible); it is also the default mode for symbol sizes, since the symbol usually occupies a few pixels and we usually want a size of the symbol similar to that of the screen.
- If paper units is choosen:
- In the case of constant thickness, radius, etc, we will indicate, in mm of the printed paper, the desired thickness, radius, etc.
- In the case of thickness, radius, etc, by database field (i.e., by attribute) we will indicate how many mm of the printed paper correspond to each pixel on the screen.
MiraMon will apply the same proportionality to the different values of the database fields. Note that this mode allows, for example, to define lines that are thinner than those that a screen can draw, which in automatic mode is not possible; in other words, in Automatic mode (WYSIWIG) when printing a line on a printer it imitates the thickness on the screen and we may find thickness (usually a screen pixel occupies about 0.3 mm) excessive from a conventional aesthetic point of view. That is why this mode is the default mode in thickness of lines and edges of polygons and it is applied that 1 screen pixel is 0.2 mm. This mode also ignores, when printing, the exaggeration factor set through the "Map | Advanced" button".
- If user exaggeration is choosen, the program works as in versions prior to v. 5.5, applying, when printing, the exaggeration factor set through the "Map | Advanced" button. This option intends to give the same printed appearance for maps created with those versions in some configurations of certain print devices, but generally its use is not recommended.
In old systems, Windows
did not allow lines being more than 1 pixel width and of non-solid style
(if you indicated a width of more than 1 pixel, or its equivalent in map
units, Windows simply drew the desired width in solid style). On the other
hand, be aware that the faster drawing performance is obtained when lines
are 1 pixel width.
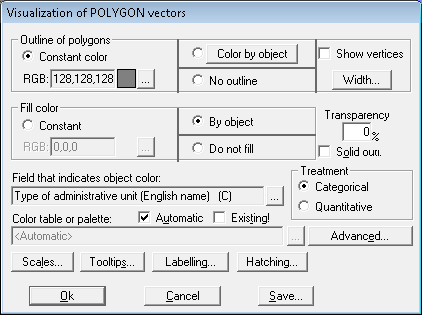
Visualization of polygon vectors: Regarding to polygon
vectors, MiraMon allows several options for color, width and polygon line
style, and also for color and hatching to fill
polygons.
The color, width and line style of the polygon outline are
controlled in the same way as in ARC files,
as well as the Show vertices option, data Treatment and Advanced options.
MiraMon allows filling polygons through the option fill color with a constant value (the default color is white,
although it can be modified with the three-points button), or with an indexed
color for each object (using one of the associated database fields and a
color symbolization table). You also have the option of not to fill it in.
For more information, consult MiraMon
symbolization tables.
When the symbolization is automatic, the option Existing! can be activated, which indicates to MiraMon that it should perform an analysis to include, in the automatically generated table (and, therefore, in the legend), only those elements that exist in the layer, regardless of whether the field contains them. This option is useful when making clips or selections of a layer symbolized from a field in a joined table, when we want all the elements of the field not to appear, but only those that are really present in the layer; for example, perhaps the field contains the county names in a county thesaurus, but our layer only contains 5 of the 42 possible counties. In the case of numeric fields this option has the effect of restricting the values to be used to those used by graphic objects.
It also allows to choose the degree of transparency of the polygons, in percentage, with values between 0 and 100 %.
MiraMon allows
filling polygons using hatching and giving them several colors. If you
press the button "Hatching...", the box Hatching
will appear in which it is possible to choose the hatching style and color. The
default value does not have hatching, so the polygon is filled depending
on the color options used (do not fill, constant or by object). For more
information, consult MiraMon symbolization
tables.
All these displaying
visualization characteristics of PNT, ARC and POL can be stored in the REL
file through the "Save" button of the dialog box; by doing this, next time you
open this vector layer, the current characteristics will be used as
default and the dialog box will not appear to define the symbolization. On the other hand, each time you store a MiraMon Map composition
(*.mmm), the current displaying characteristics become the default
regardless of the values specified in the REL file. For more information,
consult MiraMon vector format description and
MiraMon map and template format
description.
Note: It is
possible that when you do mouse querying, the information about palette
color is not always coincident with the information about screen color.
There are several reasons for that:
- The
driver of your graphic board does not allow, or is not configured, to
show 16 million colors (it is possible to see how many colors MiraMon detects in
the "Help | About" box). Here, the screen color will be similar to the palette
color, but in many cases it will not be the same, and it will be different the lesser colors your system allows. To solve this change the graphic board
or properly configure the driver.
- The
queried object is "overlapped" by another object. For
instance, suppose you have a polygon file loaded over a raster file and
you query over the raster: the screen color for the selected pixel will
be the corresponding to the covering polygon.
- The
object is a polygon and it is represented by two different colors, one
for the outline and another for the interior. If one of the parts, for
example the interior, is represented through a palette and the other
one, the outline, is represented with a constant color, and the
selected point is over the outline, we will obtain as a screen color
the constant color (or the nearest one your graphic board allows); that
color will be usually different from the color that MiraMon says that
is the element palette color. Remember that constant colors for
outlines and/or interiors are showed, in RGB form, in another part of
the given information of the query results.
- The
selected element is a structured polygon vector that we represent as
transparent. As structured polygons allow querying by mouse clicking
inside, MiraMon will inform about the palette color of the polygon
outline (unless a constant color was selected), but the color screen
will be that of the clicked screen pixel.
- The
selected element is a line or a polygon boundary, and we consult it by
clicking between two vertices. In this case, and due to the algorithm
used to represent line vectors on raster devices (as the screen is), not
all the pixels affected by the line are "painted", but only
the more clearly affected, to avoid an excessive thickness. This causes
the screen color of the selected pixel can be a "background"
pixel instead of a pixel "painted" by the line. Here the X,Y
coordinates of the point will never be informed as "final" nor
"intermediate", but "computed".

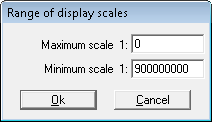
Each loaded vector file has a
range of scales at which it can be viewed. When the displaying scale is
outside this range the file will not be drawn. This is useful for hiding a
detailed theme that might otherwise clutter up your display at small
scales, or to set up a MiraMon Map in which different vector layers
progressively appear when you zoom in. Conversely, at some detailed zoom
you may wish that some layer disappears because it is not relevant at such
scale (for example a layer containing country names). The  dialog box allows saying the largest scale (for example 1:5000) and the
smallest scale (for example 1:250000) in which we wish to display this
file. When the scale is larger than the former (for example 1:500) or
smaller than the latter (for example 1:1000000) the file will not be
shown. To display always, regardless of the scale, you should indicate 0
and 9000000. The values refer to the denominator of the scale.
Important: the scale also affects the printing, therefore with
certain scales some layers appear or disappear, depending on the scale
configuration.

MiraMon allows different scrolling options in the main window:
- If you press
on the outermost arrows of the scroll bar, you will move one map cell
towards this direction. The cell has the size of a pixel when there is an open raster and the management mode is "raster". In other cases, a "virtual cell" is calculated according to the extent, etc.
- If you press
between the thumb and the arrows, you will move the map towards this
direction the same size as the whole current displaying area (1
"page").
- It is also possible to
manually drag the thumb until where you wish; you just have to know
that the horizontal and vertical scroll bars size represents the width
and height of the map.
- If the view is dragged and you do a second click wherever it is convenient.
Using the
keyboard, it is possible to get these scrolls through the following keys:
|
|
1 cell
|
1 page
|
Outermost
|
|
Up
|
Arrow
|
PgUp or Ctrl+Arrow
|
Ctrl+PgUp
|
|
Down
|
Arrow
|
PgDwn or Ctrl+Arrow
|
Ctrl+PgDwn
|
|
Left
|
Arrow
|
Ctrl+Arrow
|
Home
|
|
Right
|
Arrow
|
Ctrl+Arrow
|
End
|
When you resize the window, the corner which remains as reference is always the
upper left one.
If you have
loaded vectors and you make scroll or zoom operations, it is possible to maintain
any of the Shift keys pressed to avoid vector redrawing at every new view,
so that the process of locating an interesting area of the raster becomes
faster. For more information, consult Interrupt vector and WMS/WMTS redraw with Shift from the "View | Special" menu.

MiraMon allows
you to work with more than one session at the same time, when you wish to
compare two files from the same zone, or the same file in different
scales, etc. It is possible to geometrically synchronize all the opened MiraMon sessions through Synchronize from the Zoom
menu.

MiraMon allows
you to show the legend of the layer (or layers) that is visible and/or
consultable in the client area. The legend shows the title and the legend
of the files that you are displaying. It is possible to turn on and turn off this
window with the F11 key or with "Information | Show legend". In non-IMG raster files, visualization and legend features are also read and written, which facilitates the design of maps with raster in BMP, etc, formats. The layers of nodes show, in the legend, the symbols of the different types requested. This is useful for the easier understanding of the vector topology, the correction of vector digitizing errors, etc.
The starting
point, width and height of the legend box (X, Y, Wide, High) are set
by the parameter "PosicioDimensioLlegenda" in the MiraMon.par
file, and the units are screen pixels. The legend can be always visible by default by indicating, in MiraMon.par, IgnorarMostrarLlegenda=1.
The legend includes all the open
layers if in the "Modify layer order and properties" box
for each layer the option "Visible in the legend" is
activated. The order in which the layers appear in the legend corresponds
to the order assigned to the layers in the "Modify layer order and
properties" box.
To save space on the screen, only
a limited number of categories are shown, but if the legend has more classes, the
 buttons will allow you to navigate
through them (this process does not affect the map colors that you are
displaying). Note that, to save space MiraMon does not show the empty
classes in the legend: if the 1,2,3 and 255 classes are described in the
REL, MiraMon will not show the color box for the 0 class nor for the
4-254 classes, although they are marked in "Visualization of the
layer in the legend" box. buttons will allow you to navigate
through them (this process does not affect the map colors that you are
displaying). Note that, to save space MiraMon does not show the empty
classes in the legend: if the 1,2,3 and 255 classes are described in the
REL, MiraMon will not show the color box for the 0 class nor for the
4-254 classes, although they are marked in "Visualization of the
layer in the legend" box.
In the legend, each layer
corresponds to an entry. MiraMon makes it easy to modify the properties of the layers using the
legend. The following box is incorporated next to the layer title of the
legend:

The first square can be
negative (this indicates that the layer is symbolized based on a
field, so it is an indexed symbolization) or positive (indicating
that the symbolization is constant). If you click on this box, you will
access the "Visualization of the layer in the legend"
box. The second square, if activated, indicates that the layer is
visible. Otherwise, it is not shown in the client area. The third
square, if activated, indicates that the layer is queriable.
Last, there is the GeM+ icon, if you click on this icon you access
the Universal Geospatial Metadata Manager layer. Note that is possible to open GeM+ from the metadata button of the legend, from the "Tools | Metadata manager" and from the "Information | Opened rasters/vectors" box. When you change the "visible" or
"queriable" state to a layer that belongs to a cartographic
series, the change is automatically propagated to all the opened sheets of
the series.
The "Layer... " button,
located in the previous icons, is especially useful when you decide to
show again the layer legend you had made disappear. Otherwise, there is no
way to access it (unless you go directly to the information kept in the
corresponding map or you open the layer again as an individual
file).
The legend box allows you to
edit the colors if you double
click on any color that appears. This is an alternative route to
"View | Change palette ... ", you choose a layer from the list
and click on "View... ". Be careful: if you have previously
requested to reduce the number of classes shown in the legend, the
published color is only that "sample" not the entire range.
Remember that if you want to publish a range of colors simply indicate it
in the corresponding box: [34, 57].
Almost all raster and vector
layers (structured or not) have an entry in the legend. Legend shows
chosen colors and categories, allowing you to reduce the number of
categories that are displayed (useful in palettes such as GREY256 on
photographic or satellite images and DEM256 on DEMs). The presentation
order of categories can also be inverted (useful in DEMs and contour
lines, where it is more natural to see the highest values at the top of
the legend). In addition, some layers can be excluded from the legend (for
instance administrative limits that you just want as a general reference
but you do not want to see in the legend). These parameters can be
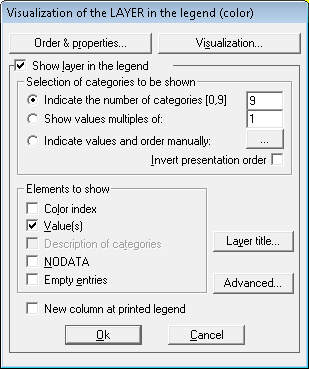
modified using the "Visualization of the LAYER in the
legend" box, which you access through the positive or negative
box that appears in the legend.
 : :
The layer visualization box in
the legend allows you to access the Order
& properties... box. This is an alternative route to
"Visualization | Modify layer order and
properties".
 : :
The layer visualization in the
legend box also allows you to modify the visualization characteristics of
a file. You have to press the "Visualization" button, which will
take you directly to the general characteristic visualization box
(visualization of different types of vectors: polygon, line/arc, etc). For
more information about general visualization of vectors, consult Vector Visualization. The symbolization for rasters can be
changed. For further information regarding the general raster visualization, see Rasters display. This is an alternative route to "Visualization | Modify
layer order and properties", you choose a layer from the list and
click on "Visualization... ".
Selecting which categories to show:
With MiraMon it is possible to indicate the
number of categories that are shown in the legend. To show various
categories of certain values (which is useful for example in Digital
Models of Elevations in which you want to show multiple categories of
200), or to manually indicate the values and the order of the categories
shown.
When you have decided to
represent only 'n' classes (for instance in a DEM we say we just
want to see 5) and these have values of type interval, MiraMon will show
the central value of each of the 'n' selected intervals. In the
opposite case, it would be strange to see:
[350-449]
[750-849]
:
(because there is no continuity
in the intervals, and doing [350-749] would be false from the chromatic
point of view) and it results more natural to see:
400
800
:
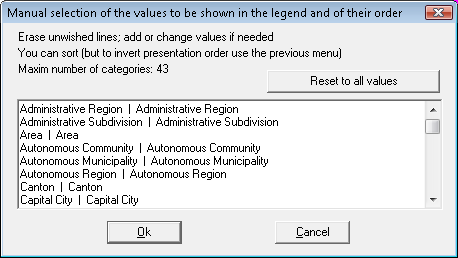
If you decide to indicate the
categories to be shown manually, you have to press the  button to access the "Manual selection of values to be shown in the
legend". In this box, it is possible to erase categories, modify the
order, etc. button to access the "Manual selection of values to be shown in the
legend". In this box, it is possible to erase categories, modify the
order, etc.
If you want, it is possible to invert the presentation order of the categories in the legend by
activating the box used for this purpose.
Elements to show:
With MiraMon it is possible to
give three types of information next to the symbolization of each
class (entry) of the legend, which is represented using the same
color, line width, icon, etc, that the screen shows:
- Color
index (palette color that will be used to paint the class).
Obviously, this entry will never appear in point symbology through
metafiles.
- Numerical
value in the file (pixel value in a radiometric image [0,255],
heights of a contour line, name of a country, etc). When the number of
values is greater than the number of palette colors, the shown value is
actually a range of values (in a DEM can be [350-449], [450-549], etc).
As in the former case, this only applies to layers where it makes some
sense.
-
Category
description
In addition, it is possible to show
NoData fields, as well as the empty entries, if you
activate the corresponding options.
It is possible to choose to see all them
independently, although some of them make no sense (for instance a DEM has
no categories and only the color index and the numerical value will be
shown) or they can be redundant as well (color indexes and numerical
values in byte images).
 or or  : :
When you press the button
"Layer title..."
or "Series title.... if it is a cartographic series, you will
access the "New layer titles" or "New series
titles", where it is possible to specify the title of the layer/series as
well as the title of the layer/series that you want to visualize in the
legend.
 : :
If you press the button
"Advanced" you will access the advanced options box from
the legend, where it is possible to define several options for visualizing the layer
in the legend. These options are different depending on the type of
layer:
-
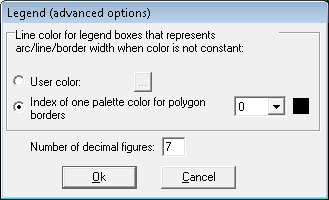
Arc structured files and line
non-structured files:
When the color of the
arcs/lines in an arc/line file is not constant, but rather indexed
according to a database field, and the width of the arcs/lines is also
indexed by a database field, the advanced options of the layer
symbolization in the legend allow you to define the symbolization
color of the arc/line width. The user can define the color or it can
be one of the colors used in the arcs/lines color symbolization
table. When using a numeric field of real values, it is possible to choose how
many decimal figures to show.
For example, in an arc layer
that symbolizes highways, maybe you want to use a color for each
highway and different widths for each type of road (motorway, highway
of local or regional importance, etc). In the legend, MiraMon uses two
entries to symbolize the layer: first, the list of all the highways
with different colors for each one appears, and, second, the width
symbolization of each road type appears. In the second case, MiraMon
allows you to choose, using the "Advanced" button, the
color to use for the road type symbolization (arc width). For
example, it is possible to choose a user color (any color) or
one of the colors used in the name of the route symbolization (for
example, the represented most route).
-
Polygon structured
files:
In the case of polygon
structured files, as in the case of arc/line files, MiraMon allows you
to define the color of the polygon's width symbolization. The
user can define the color or it can be one of the colors used in the
polygon color symbolization table. For more information, read the
previous section.
On the other hand, when you
want to fill in polygon files with a color indexed by a database
field and the outlines of the polygons are also indexed by a database
field, MiraMon allows you to define, using the "Advanced"
option, the color used for the frame or the box that symbolizes the
colors used to fill in the polygons. This is useful if in the
cartographic region base you want to symbolize the polygon outlines
that define the different regions with a different color for each
region, and also if you want to fill in the region with a different
color based on the province the region belongs to.
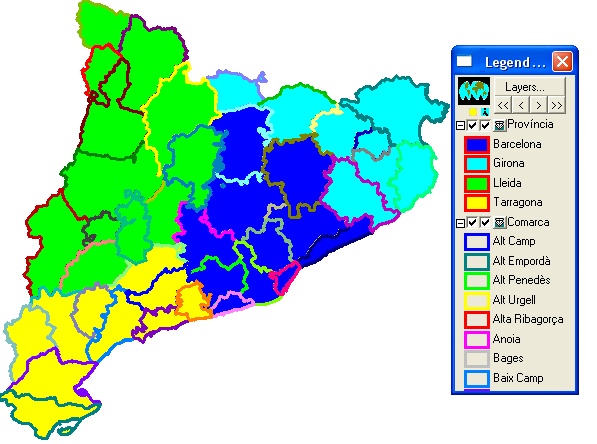
In the previous example the
frame of the box that indicates the color used to fill in the polygon
is red and corresponds to the fourth color in the region outline
symbolization table, although it would be possible to symbolize it
with a user color, without an outline or with an inner polygon
color. When using a numeric field of real values, it is possible to define the
number of decimal figures.
-
Raster
files:
In the case of raster files,
using the advanced options it is possible to define the number of decimal
figures if it is a numeric field of real values.
Control of the legend from MMM and REL
files:
For a certain layer, there are
several parameters that determine how the legend is shown (color,
hatching, width, etc). Each parameter shown here has some letters that go
before it. To simplify the explanation, we have put the text
"SMB_" before each parameter, but this text must be changed
for each symbolization aspect. For instance, with "Color_" when
it refers to the color used to fill in the polygons or arc colors or
line colors; with "ColorVores_" when it refers to the polygon
outlines; with "Gruixos_" when it refers to arc/line or polygon
outline width.
- SMB_VisibleALleg -> 1: Yes; 0:
No
- SMB_TitolLlegenda -> Caption in the legend, usually
shorter than the full Caption.
- SMB_CategAMostrar -> Type of category selection to be
shown: "N": when the user indicates the number of
categories; "MULTIPLES": when the user indicates that
the number of categories to be shown it has to be a multiple value;
"MANUALS": when the user indicates order and values
manually.
- SMB_N_ClassesLleg -> Number of classes that you want
to see. Typically, all classes (enter "-1" if the exact number
is not known), but for a grey scale image or a DEM can be, for ex., 10
classes.
This parameter is changed using
- "SMB_N_EntradesManuals"
when the user indicates the values manually which indicates every
value in the order that the user prefers.
- "SMB_MultiplesDe" when the user has chosen to show multiples of a value and the chosen value is shown after the parameter.
- SMB_InvertOrdPresentColorLleg -> 1: Invert
presentation order; 0: do not invert.
- SMB_MostrarIndColorLleg -> 1:Show class color
index in the legend; 0: do not show.
- SMB_MostrarValColorLleg -> 1:Show class value
(or range of values) in the legend; 0:do not
show.
- SMB_MostrarCatColorLleg -> 1:Show class
category (descriptive text) in the legend (if it exists); 0: do
not show.
- SMB_MostrarNODATA -> 1: Show a category for
NoData values; 0: do not show.
- SMB_MostrarEntradesBuides -> 1: Show a category
for empty values; 0: do not show.
Legend control from MiraMon.par
file:
The following parameter affect
layers for which neither the MMM nor the REL files indicate the parameters
of the former section. It can be modified after having started the program
from "Information | Legend default options" (but it will not
affect previously open layers).
- MostrarIndColLleg -> Tells us what to do when opening
a file if there exist classes to show but neither the MMM nor the REL
files specify the value of "SMB_MostrarIndColorLleg".
1:Show the color index of the category in the legend; 0:
do not show.
Default
options:
This section explains the default
options that MiraMon takes when MostrarIndColLleg is not indicated in the
MiraMon.par file.
This section is important if the
program's default behaviour is to be understood. Numbers are explained after the table.
| RASTERS |
Color index |
Value |
Category description |
| If it is a byte, bit, short, long, etc,
thematic raster with legend into the REL file. |
Yes (1) |
No |
Yes |
| If it is a byte image with continuous
values (images from optical or electronic sensors) and there is
no legend into the REL file. |
No (2) |
Yes |
- |
| If it is a short image with continuous
values (NOAA) or DTM short (DEM, DSM, ...) and there is no
legend into the REL file. |
Yes (3) |
Yes |
- |
| Layer with real values (values of
type "float", such as the temperature) and there is no
legend into the REL file. |
Yes (3) |
Yes |
- |
| Layer with long values and there is no
legend into the REL file |
Yes (3) |
Yes |
- |
| RGB combination |
- |
- |
- |
| JPEG, JPEG2000 , MrSID, BMP, DIB files,
etc. |
- |
- |
- |
| VECTORS |
Color index |
Value |
Category description |
| "String" attribute in DVC file or field
'C' in DBF file; constant colors. |
- |
- |
- |
| Numerical attribute. Not linked to a thesaurus (all
VEC files are included) |
Yes (3) |
Yes |
- |
| Numerical attribute. Linked to a thesaurus |
Yes (4) |
No |
Yes |
(1) It is activated depending on
the default value of MostrarIndColLleg in MiraMon.par. For byte and
bit files it is coincident with cell values and, therefore, it is not
advisable to activate "Value" is this case. In short, unsigned short or long
images, it may have sense to activate "Color index",
"Value" and "Category description ".
(2) It is not activated because
it is redundant to "Value". It is allowed to activate the
redundancy for educational purposes (for instance show MDE byte in regions
of height lower than 256 m). Categories do not exist.
(3) It is activated depending on
the default value of MostrarIndColorLleg in MiraMon.par, but it is
recommended to activate it because normally values are different to
"Value". Categories do not exist.
(4) As 3, but categories
exist.
 In the tutorial Modificar la llegenda (authorship: Joan-Cristian Padrˇ; original audio: Catalan) and Configurar leyenda (authorship: AAECAD; original subtitles: Spanish) information regarding the management of the legend is provided. In the tutorial Modificar la llegenda (authorship: Joan-Cristian Padrˇ; original audio: Catalan) and Configurar leyenda (authorship: AAECAD; original subtitles: Spanish) information regarding the management of the legend is provided.

|
