 |
MiraMon symbolization |
| General concepts of MiraMon symbolization | Symbolization tables in MiraMon |
| MiraMon symbolization videotutorials |
General concepts of MiraMon symbolizationMiraMon allows a wide range of symbolization (colors, hatching and patterns for polygons, sophisticated fonts for texts, point symbols, semitransparencies, etc) as well as visualization of layer in the legend (how many of these symbols are displayed in the legend and how they do it). The symbolization is made from a symbolization table (of colors, of hatches, fonts and icons), where it is defined, for a certain number of entries (records), the symbolization (the color, the hatch, etc) associated to each one of them. Prior to the description of each symbolization table, it is necessary to understand some key concepts about the symbolization: 1. Format and content of MiraMon symbolization tables 3. Symbolization in the layer and symbolization in the legend 4. Combined symbolization of lines 1. Format and content of MiraMon symbolization tables1.1 Format of symbolization tablesThe symbolization tables can be integrated into the relational schema of alphanumeric tables associated with the objects of the layer or they can also be isolated tables. In all cases they are supported in DBF format or in any format accessible via ODBC (Access MDB, Oracle, etc); in this last case, they can be physical tables, predefined views or dynamically constructed SQL queries. The fields accepted by the MiraMon tables can be character, numerical, date and logical type:
 This denomination must be understood as generic, not linked to any specific format (DBF, MDB, Oracle, etc) and without prejudice to the limitations of certain database formats (for example, logical fields do not exist as such in certain managers). In general terms, character and logic fields type are used to express categorical variables and fields of numerical and date type are used to express continuous and ordinal quantitative variables. However, a field of numerical type and date can also be treated categorically if it is explicitly documented in the metadata file as a categorical type or the treatment in the layer display options has been modified, for example, that a numerical value 123 is interpreted as a text "123". Likewise, a field of categorical type can be treated as numerical if it is explicitly documented in the metadata file as continuous quantitative type or ordinal type (or by modifying the radial buttons of the layer treatment), with the purpose, for example, that the text "123" be interpreted as a numerical value. However, these cases, are not usual. If it is wanted to optimize the opening of databases containing large DBF tables, it is recommended to have them in the ANSI character set and not in OEM in order to not to have to make translations during the symbolization operations in which type 'C' fields are involved. 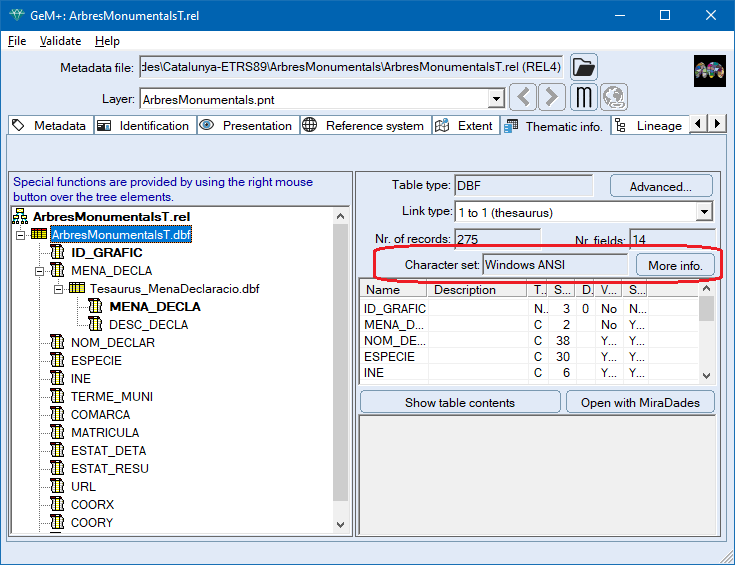 1.2 Content of symbolization tablesSymbolization tables contain several fields, some common to all symbolization tables and others that are specific depending on the corresponding symbolization (color, fonts, etc). Common fields for each type of symbolization:
Specific fields for each type of symbolization:
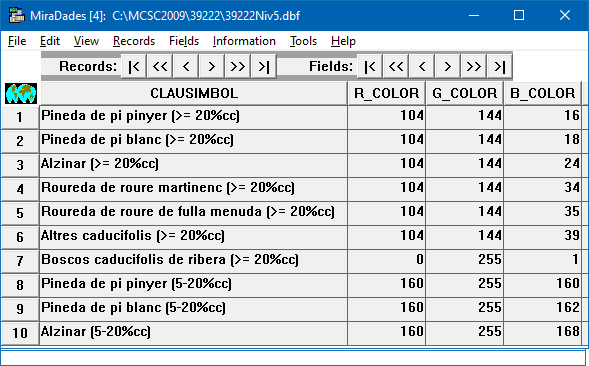
Specific information about the symbolization of color, hatches, fonts, etc, can be found in MiraMon symbolization tables. 2. Symbolization typology: constant for the whole layer or indicated according to a field of the databaseIn MiraMon, each type of symbolization (color, hatch type, hatch color, etc) can be constant for the whole layer (that is, a single symbol -color, hatch, etc- for the entire layer), or it can be variable depending on a field of the database (any field of any table in the database). The following figure shows, in the upper part, a map in which the symbolization of color is constant for all the variables (main roads) and, in the lower part, the same map with the color symbolization indicated in function of the field "type of road". Thus, in the first case all roads appear in the same color (blue) while in the second case, each road (type of road) is assigned with a different color. 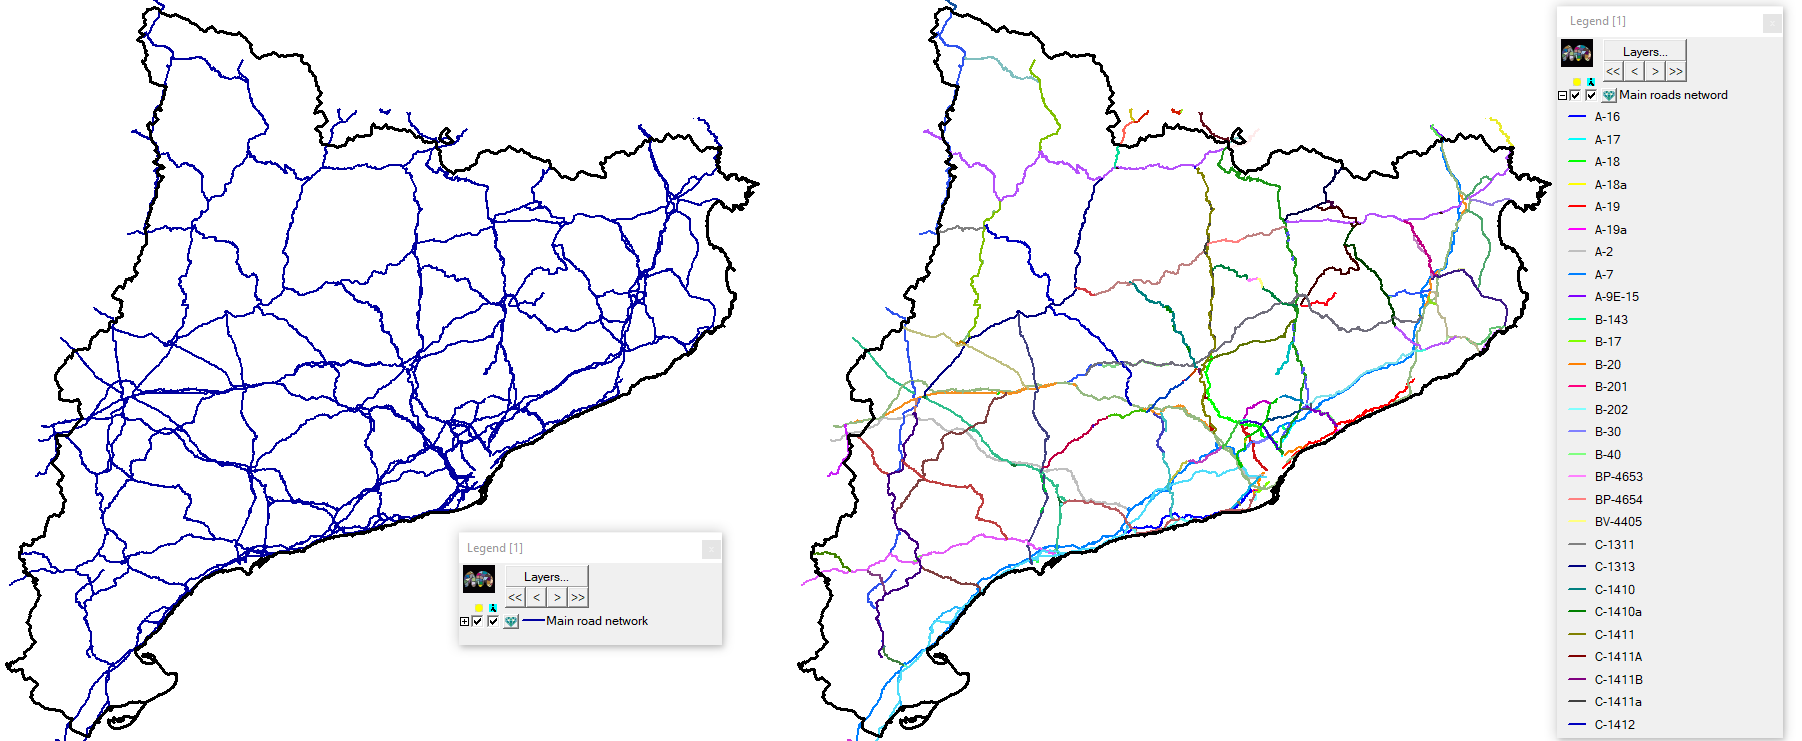 In the symbolization indicated by a field of the database, MiraMon considers two cases according to the type of information treatment of the field that indicates the symbolization:
To modify the usual treatment of the variables, it is enough to modify the option that appears by default in the "Treatment" section of the layer display box.  For both cases, once the field indicating symbolization is defined, a preexisting symbolization table can be chosen or a new table can be created (for example, choosing the "Automatic" table, modifying it with the "Advanced" button as convenient and saving it as a new table). In essence, this choice determines how many different symbols (for example how many colors) will be used for the visualization of the field. MiraMon will make a projection of the selected field to know how many different values appear in the field. 2.1 Symbolization indicated by a CATEGORICAL type field of the databasea) New symbolization table If a new table is chosen, the program will create a new table in memory with the appropriate viewing conditions (remember that this table can be saved at any time through the menu "File | Save palette or symbolization table", and the linking with the REL file can be saved with the "Save ..." button present in the dialog boxes where the display conditions are established). The table presents the fields defined in the format section of the symbolization tables (CLAUSIMBOL, DESCRIPTION and the field or fields that describe the symbolization, such as R_COLOR, G_COLOR, B_COLOR). The CLAUSIMBOL field is, in this case, categorical type and contains the projection of the field that indicates the symbolization. Therefore, the new table will have as many records as this projection. Since the field indicated by the symbolization is categorical, the field or fields that describe the symbolization will be filled with different values (for example, different values of hatches, such as "I", "-", etc). If the number of different symbols is insufficient for the number of records of the projection, the symbols will be repeated (for example, if the field is the name of the more than 900 municipalities in Catalonia and the type of symbolization is hatch type, the different types of hatch available will be assigned in a rotator way to the different municipalities). If the field indicating the symbolization contains NoData values, the field or fields that describe the symbolization will be assigned with the default type indicated in the MiraMon.par file and in the field CLAUSIMBOL the special literal "%NODATA%" will be indicated. If it is wanted to modify these associations later, remember that leaving the contents of the field or the symbolization fields blank implies not drawing the object (leaving the polygon transparent, leaving the line invisible, not drawing the symbol of a point, etc). Thus, the use of empty (or completely blank) strings can be used to indicate that the category should not be visible in the legend if the corresponding option is activated in the dialog box "Visualization of the LAYER/SERIES in the legend". If the new table, created automatically, has been modified (for example by changing a color of those automatically proposed by MiraMon), it will be warned, before closing the layer, of the convenience of saving the table and saving the link via the REL file corresponding to the layer and/or via the possible MiraMon Map (MMM) generated. b) Pre-existing symbolization table If a preexisting symbolization table is chosen, the program examines the fields in the table and follows the following logic:
 The association options that can be chosen in this dialog box are the number of symbols to be represented and the symbol to be used (for example the color of each category). If the symbolization table is modified, remember that pressing the "Save ..." button will preserve the changes. If the "Special cases" button is pressed, the handling of some specific cases of symbolization can be chosen. 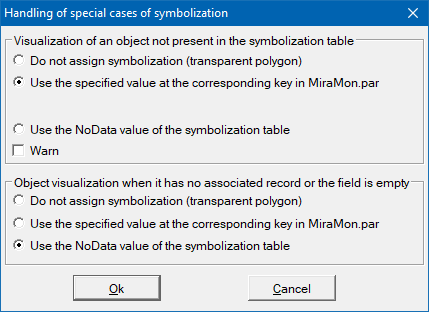 When the field indicating the symbolization contains a value that is not found in the symbolization table, by default, MiraMon assigns the symbolization indicated in the MiraMon.par file in the "ColorObjectesSenseAtribut" key, such as, for example, black color association (0,0,0). However, this option can be modified, choosing not to assign symbolization so that the polygon will be transparent, or to assign the symbolization as NoData, with the activation of the warning in case of occurrence if desired. A different case is when the field indicating the symbolization is empty or contains no record. In this case, by default MiraMon applies the NoData value from the symbolization table. However, it can also be modified, by not assigning any symbolization (transparent polygon) or by assigning the value indicated in the "ColorObjectsSenseAttribute" key of MiraMon.par. 2.2 Symbolization indicated by a field of the database of CONTINUOUS or ORDINAL QUANTITATIVE typea) New symbolization table If defining a new table is chosen, the program will create in memory a new table with the appropriate visualization conditions (remember that this table can be saved at any time through the menu "File | Save palette or symbolization table", and the linking with the REL file can be saved with the "Save ..." button present in the dialog boxes where the display conditions are established). The table shows the fields defined in the format section of the symbolization tables (CLAUSIMBOL, DESCRIPCIO and the field or fields that describe the symbolization, such as R_COLOR, G_COLOR, B_COLOR). The CLAUSIMBOL field is, in this case, numerical type and contains the projection of the field that indicates the symbolization. Therefore, the new table will have as many records as this projection. To know if the field that indicates the symbolization contains an ordinal type variable or a continuous quantitative type, MiraMon consults the metadata of the field. In case it is not indicated, by default it is offered the one that seems most likely according to the number of different values that appear in the field and the type of numerical values (for example, the presence of real values seems to indicate that it is a field of continuous quantitative type). MiraMon shows the real number of different values that exist in the field that indicates the symbolization and allows to indicate the number of desired values. It also allows the user to choose between defining classes based on user-defined intervals or based on automatic numerical assignation (direct correspondence, linear stretch, logarithmic stretch, etc). 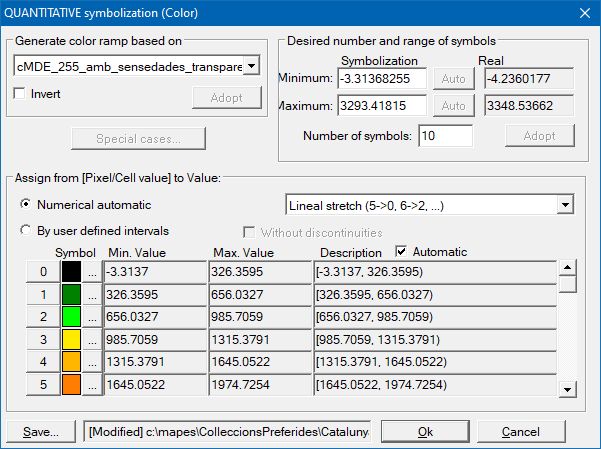 In the case of choosing By user defined intervals assignation, the corresponding On the assumption that Numerical automatic assignation is chosen, by default direct assignation is applied if possible (that is, when the number and range of values requested is equal to that of symbols); If this is not possible, displacement is applied and if this is not possible, linear stretch is applied. Whether if interval or automatic assignation is chosen, the symbolization is done, if possible (color, size, etc) in a graduated style. This graduation can be modified by pressing the button of each value. 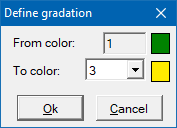 For the treatment of values without record, consult the given indications for NoData explained in the case of fields with categorical variables. If the new table, created automatically, has been modified (for example by changing a color of those automatically proposed by MiraMon), it will be warned before closing the layer. This is why is recommended saving the table and the link corresponding to the layer via REL file and/or via the possible MiraMon Map (MMM) generated. b) Pre-existing symbolization table If a preexisting symbolization table is chosen, the program examines the fields in the table and follows the following logic:
Remember that if the adopted table is modified during the MiraMon session, the program will inform of the convenience of saving the table before closing the layer and saving the linkage corresponding to the layer via REL file. 3. Symbolization in the layer and symbolization in the legendThe number of symbols used to display a layer does not have to match the number of symbols to be displayed in the legend. When a field of the database that collects a variable of categorical type is symbolized (for example, the type of road -AP2, AP7, etc-) the number of symbols used to display the layer coincides with the number of symbols in the legend (unless the user wants to hide some entries of the legend for some reason, such as little presence on the map, etc, option that can be done by manually indicating the desired values in the Visualization of the LAYER in the legend). In contrast, when a database field that collects a variable of a continuous quantitative type (such as the elevation values of a Digital Elevation Model) is symbolized, could be wanted to use a color symbolization table of 20 levels of gradation and show in the legend these 20 subentries, but is also possible, without renouncing the graduate aspect of the 20 levels, that could be wanted to show only 6 subentries in the legend. In the case of ordinal type variables, the legend usually collects as many subentries as levels are displayed, although it may be essential to make reductions in the legend in the case of layers with many objects. Below is a DEM in which the display level is 256 and, instead, the levels or subentries of the legend are 16 (multiples of 200 m). 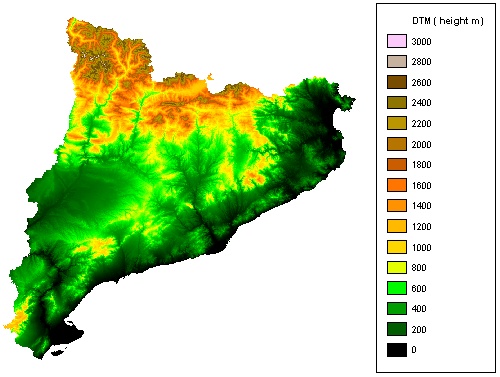 For more information regarding the display of the layer in the legend, see Modify layer order and properties, from the View menu. Multifield symbolization for the same layer Multifield symbolization can be used when it is interesting to indicate different symbols depending on different fields of the same database. For example, it can be indicated that the filling color of the polygons depending on a field of the database (in a layer of extractive activities it could be the "Current situation" -in active with integrated restoration, active and restoration not started, etc-) and, simultaneously, the user can indicate a different hatch type to each polygon depending on another field of the database (in the extractive activities it could be the "Exploited resource type" -clay, limestone, grave, etc-). 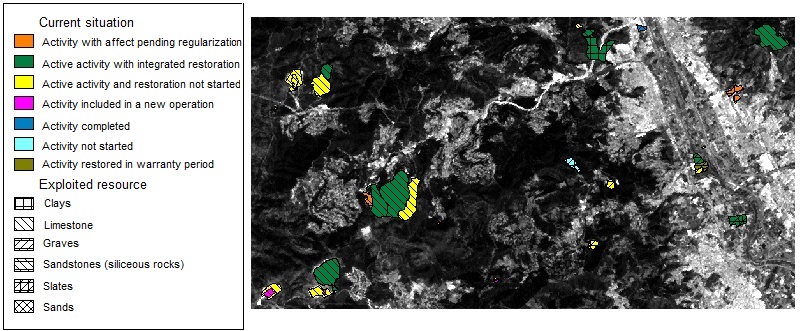 In polygon layers, multifield symbolization can be applied to the fill color, outline color, outline width, hatch types, hatch color and patterns, even a map that uses all the possibilities simultaneously will be difficult to understand. In arcs and lines layers multifield symbolization can be applied to the color of the line and its width, while in points layers, it can be applied to the type and size of the symbols. Each new concept that is symbolized "by field of the database" implies a new appearance of the layer in the legend. On the other hand, the concepts symbolized as "constant" appear in the legend with the symbolized ones. In the example of extractive activities, the fields "Current situation" and "Type of resource exploited" are concepts symbolized depending on two different database fields, and therefore, appear separated in the legend. In contrast, the quarry boundary is a symbolized concept with constant color (black) and constant width (width 2) and is therefore shown together with the field of "Current situation" and "Type of exploited resource". On the other hand, to symbolize the outline of the quarries depending on a field of the database, for example the field "Type of permission", this new concept would appear in the legend, as the following figure shows. 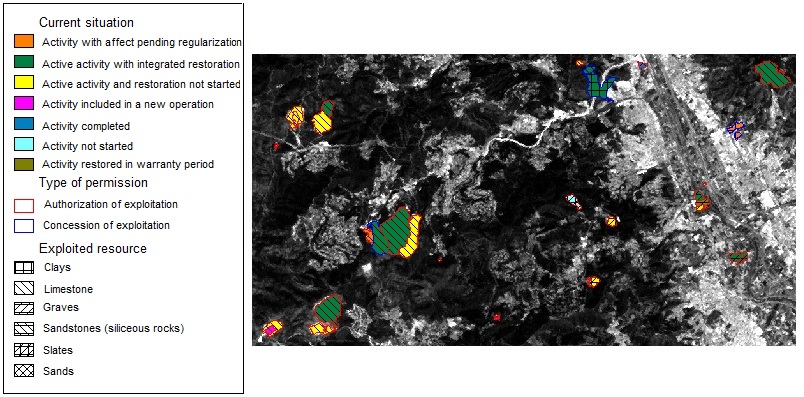 Multisymbolization for the same field Multisymbolization for the same field can be used when it is interesting to indicate different symbols for the same field of the database. For example, it can be indicated to fill color of the polygons depending on a field of the database and that, at the same time, the applied hatch type is also indicated according to the same field of the database. In these cases, in the legend there will be as many entries as different attributes the field contains, and each entry will have the double symbolization (color and hatch), since both symbols are indicated by the same field of the database. This is what is called "collapse." The collapse, however, will only occur if the symbolization criteria are identical and, therefore, it is not enough that the field of the database is the same, but also the treatment must be equal (categorical or quantitative), they must have the same symbolization table and the same number of symbols, etc. 4. Combined symbolization linesCombined symbolization lines allow to represent correctly complex linear elements such as roads, highways, etc. The combined symbolization line is generated through the superposition of several elementary lines, which are being "overloaded" to achieve the desired effect. For example, it is possible to draw a continuous line of 11 meters width and blue color and, on this, a line of points and dashes of 7.5 meters width and white color. By default, the lines are painted on a transparent background, that is, if the line has points and dashes between them, no color will be drawn. If desired, for example, a white background, just indicate the presence of a background line of this color. A combined symbolization line specifies through a text string that it can be in a REL or MMM file (the LinCombin= key) if it applies to the entire layer, or in a field (named LIN_COMBIN) of a symbolization table of combined symbolization lines. Note that the model allows, although it is not usually necessary, to define in a single layer lines with independent properties with respect to the common properties of the combined symbolization lines: for example having lines with width in map units and connection style between segments in bevel style mixed with lines with width in pixels and round connections between segments. The use of combined symbolization lines excludes the use of conventional simple lines. Thus, the presence of the key LinCombin= indicates that it will ignore the possible presence of the key ColorConstant_L= or other derived keys, such as ColorLinia= or GruixConstant_L= in the REL and MMM files, since these details are in the string itself referred by LinCombin= or in the corresponding symbolization table. The LinCombin= key may contain:
The format of the chain that specifies the combined symbolization is constituted by a series of labels that refer to the different properties of the whole combined symbolization line and others that refer to the properties of each elementary line. Each property is specified with a split bar (/) followed by a characteristic letter (sensitive to the case: do not use equally capital and lower case letters) and then, where appropriate, the value that the property takes. General properties are indicated at the beginning of the string, followed by a semicolon that indicates that the general properties have been finished and that the properties of the first elementary line begin. Important: if there is no general property, the string will start directly with a semicolon. The properties of each elementary line are also separated with a semicolon. The first line that is defined is the first one that is drawn and, therefore, it will be the "deepest" in the stack of drawn elementary lines. Do not write semicolons at the end of the string, unless it is wanted to apply a back black line of width 1 (default parameters of a line). The properties supported by the combined symbolization line are the following: For the combined symbolization line:
 For each elementary line:
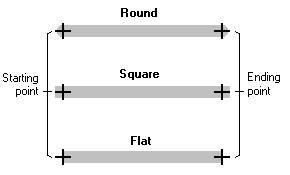 Flat and square end of line modes are shown equal in the legend because if they were combined in the same layer and painted a few longer than the others the effect would be unexpected; however, their behavior is respected if they are combined with each other or with the round mode so that the desired effect can be appreciated at the end of the line.  Some examples of combined symbolization lines: An empty string implies, by agreement, a transparent line (that is, the line is not painted). A string with a single semicolon indicates a combined symbolization line formed by a single elementary line with the default parameters: solid, black, 1 pixel width on-screen and 0.15 mm width on-printer, connection between segments in round point and round ends:
Simultaneous use of combined symbolization lines and partial multiseries: Partial multiseries allow objects of different cartographic series belonging to the same multiseries to be drawn in the same "level" of drawing. This interesting property makes possible, for example, to draw a stretch of highway above or below a county road, as appropriate. The combined symbolization lines are fully compatible with the use of partial multiseries, with which it is possible to obtain effects such as those highlighted in red in the following figure. 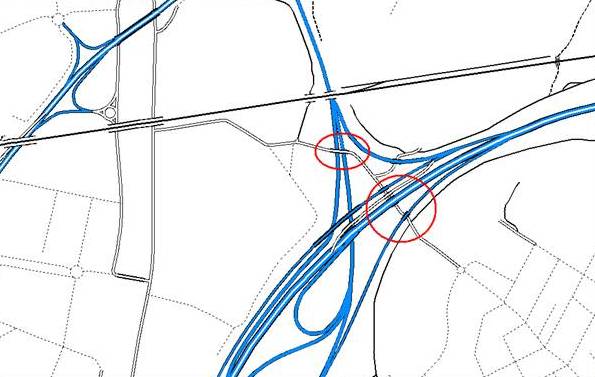 Notes for the creation of partial multiseries (MSP): Create, inside the table of the multiseries, for example, bt25mv10mm0IdTemaData_01ca.dbf, a field named MS_PARCIAL (suggested description: "Partial multiseries to which it belongs"), Character type and width 29. This field will contain, in the series that it is required, the name of the partial multiseries to which it belongs. This name is free but obviously it must be different for each partial multiseries defined within a multiseries. Additionally, the key OrdreDintreMultiSerieParcial1 within the REL file (in the section [METADADES]) of the specific layer-sheet will indicate the entities that constitute ech "iteration of redrawing". Because, at the moment, each MSP does not have other characteristics but only the name of the MSP (which is deduced from the reading of the multiseries table) and the number of levels of the MSP (which can be deduced from the number of separators that are found in the key of the layer-sheet MSP), a table or a REL file containing attributes of the MSP has not been established. However, and due to fact that the number of levels of the MSP is a characteristic that must remain common in all the layer-sheet that belong to the same MSP, it must be consistent in all the series that are part of the MSP; that is why the field named NIV_MS_PAR (described as "Number of levels of the partial multiserie") in the MSP table indicates this value; when reading the table MiraMon controls that all the values of the MSP of the same name are equal and greater than zero and will warn if inconsistencies are detected. The maximum number of levels that constitute an MSP has been set at 12, but if any user needs more, an email to suport@miramon.uab.cat must be sent and with a simple recompilation of the program this limit can be expanded as much as it is suits. Partial multiseries can only be applied to modern series, since the old series do not have a multiseries specification file to which each series belongs. User interface Besides to the indication that can be made from the REL/MMM files (constant lines for the whole layer) and from the symbolization table of combined symbolization lines (lines with symbolization indicated by a field of the database), the dialog box of Combined lines composition allows the user to interactively define all the properties of the combined symbolization lines, as can be seen in the following image:  The dialog box appears both when double-clicking from an item in the legend, and from the symbolization box of lines and arcs.
Progressively drawn Given that combined lines are used in many cases to code roads, a progressive drawing of the different elementary lines has been established so that road links are correctly established from a visual point of view. In this sense it is useful to define for all the combined lines of a road layer a base elemental line, with rounded line ends, combined with the other elemental lines bearing in mind that they will be drawn "by iterations of elemental lines" throughout the layer. This progressive drawing mode (first the first elementary line of all entities on the layer, then the second if any, etc.) provides satisfactory visual results in most situations, although it is slightly slower than the non-progressive drawn. It is in this context that it can be useful to define one of the "floors" of elementary lines as "transparent" (through the color coded as such) so that a road can link more correctly with others according to combinations of elemental lines that are being designing. The idea is to always bear in mind that in progressive drawing, the components will be drawn in iterations from the "deepest" elementary line to the most "external". The feature of progressive drawing or "by elemental lines" of the combined lines is indicated in the symbolization section of the map or REL through the key DibuixatProgressiuLinCombinades=. The default value is 1, while if a value of 0 is specified the combined lines will be drawn individually, following the order in which they appear in the linear entity file and drawing all their elemental lines before moving on to draw the next combined line. In the following figure there are three linear entities, one rising from the lower left, one transverse and one rising from the lower right. The upper figure shows the effect of NOT using progressive drawing. 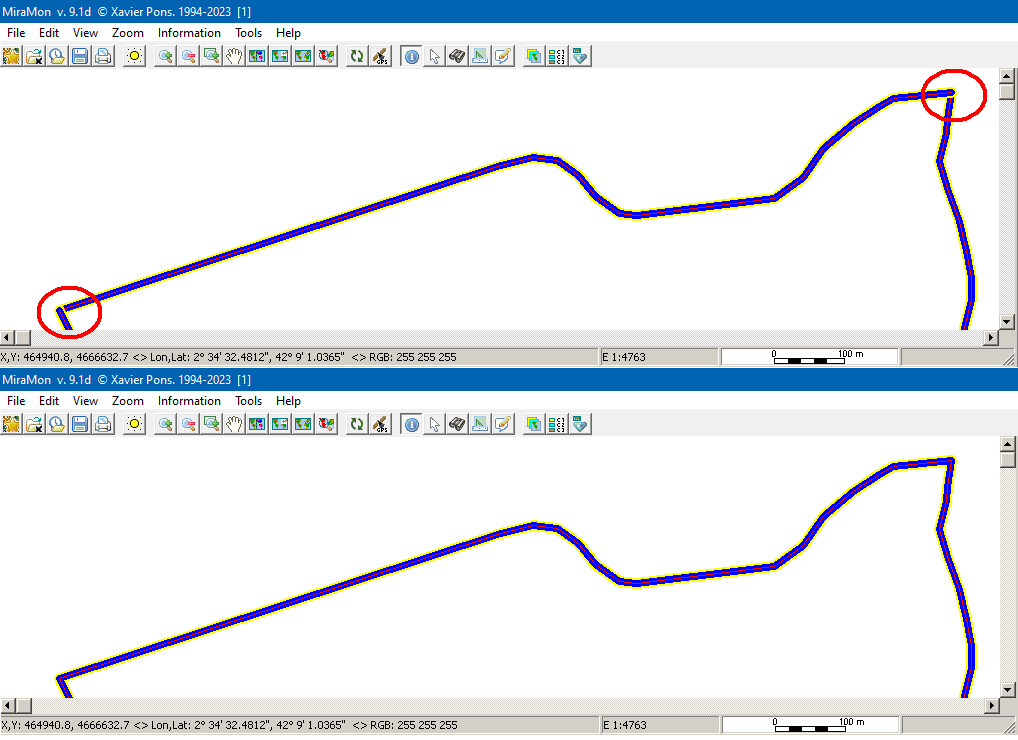 Top image: no progressives drawn. Bottom image: with progressive drawing.
Disappearance of too thin lines due to confusion with the background color When, due to scaling, a combined line is painted with the same thickness for all its elemental lines (typically this happens when they all become 1 pixel thick) and the top elemental line is also solid and practically equal to the color of the background on-screen (or on-paper in print), this combined line is not displayed. The reason for this artifact is that the color of the last elemental line "covers" the other elemental lines and gets confused with the background color. In order to avoid this undesirable effect, MiraMon adopts for the upper elemental line the color of the previous elemental line in drawn order that is not transparent.
As usual, if the first time that a field is symbolized the corresponding symbolization table is not available, it is usually more practical that MiraMon makes a first table through the activation of the "Automatic" mode. In this case the program works as usual, but with the following characteristics:
If it is necessary to make adjustments in the generated automatic symbolization table, it can be saved from "File | Save palette or symbolization table" and make them with MiraDades or, as usual, the user can then double click on the entries in the legend and changing the choice that MiraMon has made automatically, having the freedom to change any property of the combined symbolization line (colors, width, etc) of the category that has been selected. 5. Symbolization in databases from ArcSDEMiraMon allows to pass on the symbolization from REL layer files with connection via SDS. In addition, several concepts of the reading of ArcSDE have been accelerated, and among them the possibility of interrupting the loading of elements by pressing "Shift" button, as it is done to indicate other interruptions drawn in MiraMon. An object counter has also been included in the status bar to appreciate the data recovery process. In order to accelerate the process and interrupt eventually by making a new zoom or scroll while recovering the data, a simple symbolization is made (black lines, unpainted polygons, etc) that is finally repainted with the final symbolization once the program has recovered all the required elements. If the symbolization of a layer is saved in ArcSDE, it is saved in the REL from which the layer was opened, or in the temporal if it has not been opened from a REL. 6. Modification of a symbolization tableIf a symbolization table (color palette, hatches, etc) has been modified from the legend or from the "Advanced" box, the word [Modified] appears in the symbolization box before the name. In this way, by pressing "OK" the program understands that keeping the palette with the modified colors is desired (instead of doing as before, when it showed a message saying that the changes would be lost and suggested clicking "Close"). However, as it is also necessary to have a way to reload the colors of the original palette; for that, press the scan button and select again (the [Modified] mark will disappear) and the previous palette (modified) will be replaced by the new one (reread). MiraMon symbolization tables depend on the type of element to symbolize: 1. Color symbolization tablesA color symbolization table is a table in which, for a certain number of entries (records), the color associated with each of them is defined. The color tables can represent a maximum number of 65536 colors, given that internally and following the characteristics of Windows, MiraMon works with this limit. Even so, many graphic cards and printers do not support more than 256 colors, so it is advisable not to exceed this value. The maximum number of levels for each RGB component is 256. Since the version 4.0 of MiraMon, the color symbolization tables have the format explained in the general concepts section of the symbolization tables. However, MiraMon still support the different formats for the symbolization tables of the previous versions of MiraMon depending on the maximum levels for each RGB component: P25 (0,255), PAL (0,63) and P65 (0,655535). For more information, consult at the end of this section Color symbolization tables prior to version 4.0 of MiraMon. The color symbolization tables are applicable for any case of color indication: raster color, line color (arcs, polygon outlines and unstructured vector lines), polygon filling color, hatch color, etc. 1.1 Color symbolization tables in raster filesWhen a raster file is opened, MiraMon asks for the color symbolization table to be used. Every time a session is started, MiraMon offers symbolization tables (see Reading files directory), which includes gray level (Cgris16, Cgris256, etc) of digital elevation models and other continuous variables (CMDE16, CMDE256, CNDVI256, Combr256, etc), of categorical maps (Ctematic, Cdigi256, etc). Then, one of these color symbolization tables, or others that have been created previously can be chosen. Raster files (not the RGB compositions, which symbolization has a different nature) have a symbolization dialog box, so that a constant color can be indicated (which will fill the entire raster except the possible areas where there is NoData, which will be treated in a transparent way) or through a color palette. In the latter case the advanced options box can be accessed, which in the case of quantitative treatment of pixel data allows to indicate the number of colors in the palette, the desired minimum and maximum or the type of assignation (direct, linear, logarithmic, etc). As always, MiraMon continues choosing the most suitable parameters with an internal heuristic depending on the type of raster, metadata, etc, unless the file already indicates, through its REL or through the map that opens it, which are the desired options; although the MiraMon heuristic has been proven successful for many years, it is also true that in some circumstances it may be necessary to apply different symbolization strategies. In the case of RGB compositions, the symbolization dialog box allows to indicate which pixels should be transparent (none, NoData, blank, etc). From the respective raster symbolization boxes (including JPEG2000, BMP, etc) and RGB compositions it is possible to:
The transparent color has been implemented in the raster symbolization tables in a symmetrical way to the vectors, both for RGB combinations and for raster with palette (case also supported by raters of more than 256 categories). The interactive indication of a transparent color can be done through the legend, by double clicking on the corresponding symbol or, also, from the symbolization box for 24-bit files (in both RGB and JPEG, JPEG2000, etc, combinations). Its use in a layer makes its drawing a bit slower (MiraMon must analyze the presence of transparent pixels in that view and, if so, ask Windows to make the type of display, slower, allowing total transparency in some points). The properties of the total transparency are also completely symmetrical to those of the vectors: it is indicated for the RGB intensities (-1, -1, -1) in the symbolization table, it can be applied to any symbol, including NoData, and the printed legend is symbolized transparent, while on-screen legend it is symbolized with the background color that the user has chosen for MiraMon ("Visualization" menu); the interactive indication of a transparent color can be done from the legend by double clicking on the symbol corresponding to the legend, case also supported by the integer or long type raster associated with a legend (raster with more than 256 categories). It also allows the indication of transparency in the RGB combinations, in which case it is indicated with the Color_Transparent= key of the section [RASTER_RGB_ #] of the MMM files; at the moment the key can take the values "3xNoData", "NoData", "White" and "Black", which indicate, respectively, that the transparent pixels will be those with the 3 RGB NoData values, with some of the RGB NoData values, totally white or totally black; in addition to indicating it via this key of the MMM files, the transparency in 24-bit files (in both RGB and JPEG, JPEG2000, etc, 24-bit combinations) it can also be indicated through the dialog box that appears when pressing "Visualization" from the layer manager or from the legend. It is recommended not activating colors or transparent RGB combinations unnecessarily since, as it have been said, its use in a layer makes its drawing slower in Windows; if necessary, of the 4 modes, the fast one is the NoData; on the other hand, the 3xNoData mode is purely experimental because it can create strange visual effects since the pixel with NoData value on one side is prepared with a special value (typically 255) to prepare the transparency effect but if other RGB components of the pixel is different from NoData it will have lost its original value. This property of JPG files to present transparent zones in pixels containing some NoData (or forcing to do so only when the 3 RGB components are NoData) is allowed to be written and read also in MMM. With this improvement, also the transparency specifications in case of white, black, etc, are written/read in MMM. It must be considered, however, that due to the special features of the loss compression, a NoData zone in an RGB composed of 3 IMG files can present, when converted to JPEG, a small chromatic transition strip that makes some NoData pixels to present "similar" but not identical values (for example if they were 255 now they are 253) and, therefore, the transparency is not applied perfectly in the area that was NoData in the uncompressed file with original loss. 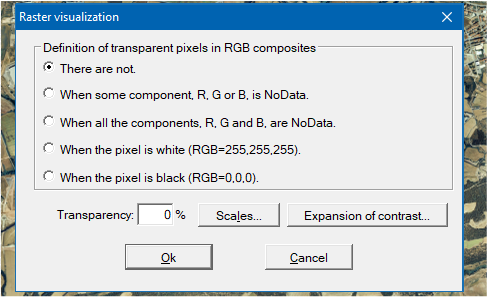  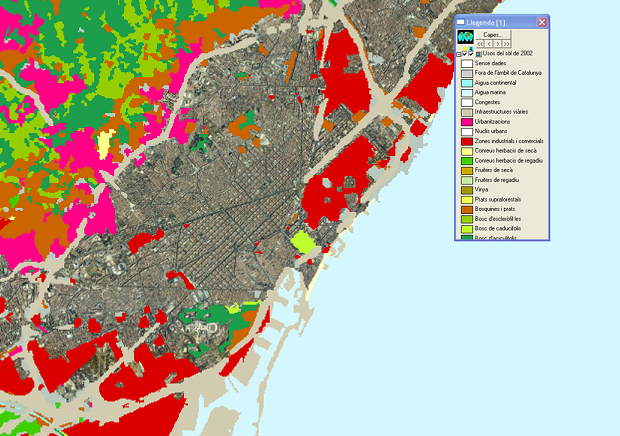 The color of the urban uses has been defined as transparent and, therefore, the raster of land use reveals, in these areas, the underlying orthophoto. It is supported, in multiband rasters, the simultaneous use of sections [COLOR_TEXT] (as a generic indication of the symbolization to be used for bands that do not have a specific symbolization section) and sections [COLOR_TEXT:NOM_BANDA] (as an indication of the specific symbolization of the band) in the same REL. Likewise, it is supported for the case of the [VISU_LLEGENDA] section. In this way, a multiband raster can now have a general symbolization for all the bands, but also a specific one for the bands that suits. 1.2 Color symbolization tables in vector filesIn the case of vectorial files, color symbolization is applicable to lines, polygons filling, hatches, etc. Every time a color is defined, MiraMon allows to choose a constant color for all objects or indicated by a field of any table in the database.
1.3 Color symbolization tables prior to version 4.0 of MiraMonFor versions prior to 4.0, MiraMon allowed different formats for the symbolization tables depending on the maximum levels for each RGB component (P25, PAL, P65). Important: it is necessary not to confuse these values with the number of colors that the palette can contain. Despite since version 4.0 of MiraMon, a new format for color tables (DBF) that allows overcoming certain limitations of the old formats is created, these are still supported. The old MiraMon color symbolization table is defined in a 4-column text file with as many lines as colors the table defines: counter Rvalue Gvalue Bvalue 0 0 0 0 1 0 97 0 2 0 162 0 3 0 255 0 4 255 255 0 5 255 210 0 6 255 182 0 7 255 138 0 8 255 113 0 9 186 85 0 10 182 125 0 11 186 162 0 12 121 101 0 13 121 65 0 14 243 243 0 15 255 178 0 The value of the counter is ignored and can be used by the user, since the first column works as a simple numerator of lines of the file (from zero), of auxiliary value when editing files with editors of text without line numbering (such as the Windows notepad) but without any value for MiraMon, because the program uses the color line (from zero) in which the color is defined as the color index. Depending on the format of the old color symbolization table, the RGB components may have a different range of values. In MiraMon, there are three old formats of color symbolization tables based on this range. That is, even though the color symbolization table can have a maximum of 256 display colors, the range of the RGB components that define each of the display colors can have 65535 levels. In particular, the three old formats of color tables, and the range of values of each RGB component are shown below: - PAL: 64 levels per RGB component [0,63] - P25: 256 levels per RGB component [0,255] - P65: 65536 levels per RGB component [0,65535] The old symbolization tables show certain limitations that make them less operative than the actual symbolization tables. Among these limitations, the lack of registration for NoData stands out. In these cases, there is no special treatment for NoData (unlike what happens in the symbolization tables). Another limitation, also very important, is that in old color symbolization tables, the field that indicates the color can only be numeric. This implies the need to define a thesaurus that links the categorical fields (which the user really wants to indicate) with numerical values that can be interpreted by the symbolization table. Therefore, it is advisable not to use the old formats and aim for the tabular format. 2. Hatching symbolization tablesHatching symbolization table is a table in which, for a certain number of entries (records), the hatching associated with each of them is defined. Hatching tables can represent a maximum number of 46 different symbols (includes the "no hatching" symbol). Hatching symbolization tables are applicable to structured vectors and unstructured vectors of polygon type. MiraMon activates by default the symbolization without a hatch, so that the polygon is filled as it was chosen in the color option to fill it (do not fill, constant color or by object). If it is desired to activate the hatching option, the "Hatching ..." button must be pressed in the Visualization of polygon vector dialog box and the access to the Hatching dialog box will be done. Every time a hatching is defined, MiraMon allows choosing a constant hatch for all the objects or one indicated by a field of any table in the database. 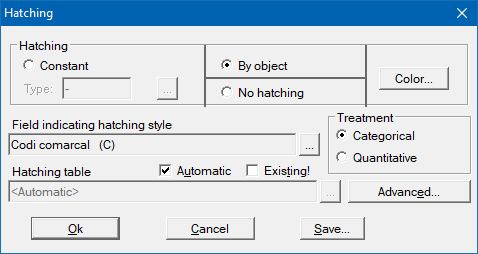
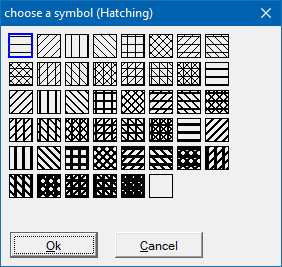
3. Font symbolization tablesTraditionally a font symbolization table defines the type of font associated with structured files of POINT type. However, since version 6 the possibility of making texts appear in entities of line type (following their direction) and polygon (placing them in their interior) is available, being possible fore the user to choose the majority of the previous properties, except those referred to the rotation of the text and the rotation of the characters, which are calculated by the program in the first case for each entity, and which are not usually necessary in the second case. As is proper in a Geographic Information System, the texts that appear correspond to properties of the entity, that is, the user chooses a field from the database (of any of the tables that belong to it) and the contents of this field are shown in the form of texts along the line or within the polygon. In addition, different objects of the same point layer symbolized differently are allowed. However, given the special complexity of the fonts (defined, as it has been explained, by an extensive set of properties), it seemed appropriate to go a little beyond the classical scheme applied to colors, hatches, etc, and as is known it is based on the possibilities of "without", "constant" and "indicated by a field of the database" (with the sophistications of categorical or quantitative treatment and, in the latter case, with linear, logarithmic stretch, etc). These extensions do not break the tended unified scheme in MiraMon symbolization, but expand the possibilities in a case, the one of the fonts, which needs extra resources in the representation on the map and in the legend. MiraMon fonts symbolization allows some properties that depend on a database field and a symbolization table (for example, the font type) while other properties can be treated individually in each entity (for example: height of the font, the inclination and rotation of the characters, etc). With these parameters it is possible to represent the texts with a very satisfactory quality, as can be seen in the three figures that come after, extracted from the BT-5M of the Institut CartogrÓfic de Catalunya in MiraMon vector format. 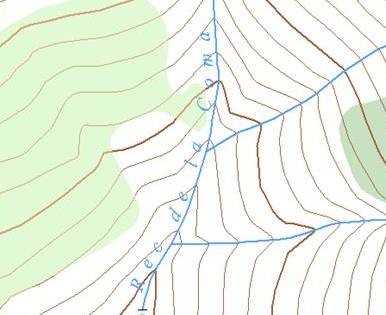  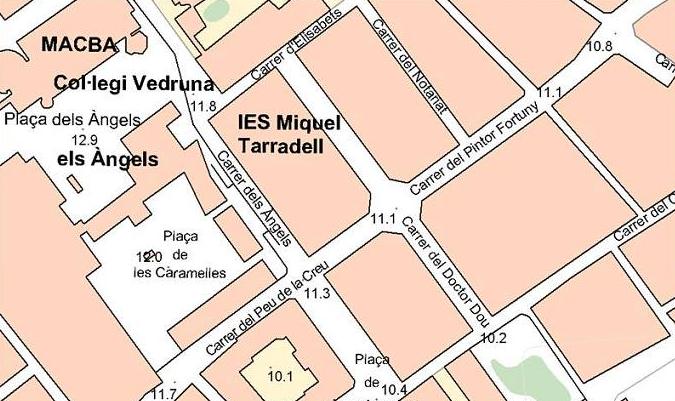 Thus, the symbolization of texts is consolidated, allowing colors, sizes in map or typographic units, characteristics at the object level, family of objects and layer, etc. Many of these sophistications have been applied with success and stability to the thousands of topographic sheets of the Institut CartogrÓfic de Catalunya distributed in MiraMon format at scales 1:5000, 1:25000 and 1:50000. 3.1 Fonts simbolization levelsThe definition of texts symbolization can be done at 4 levels:
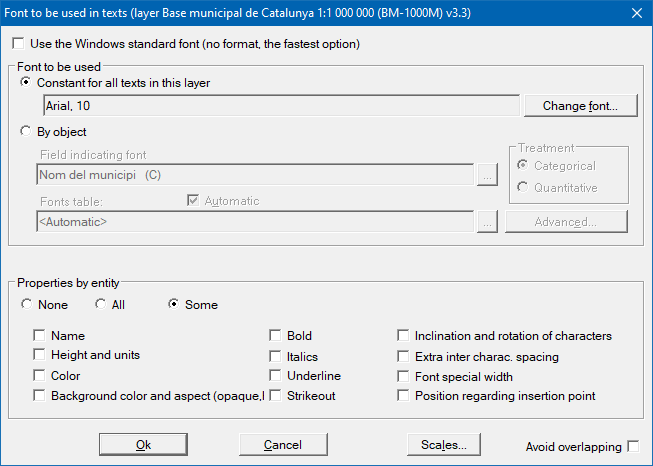 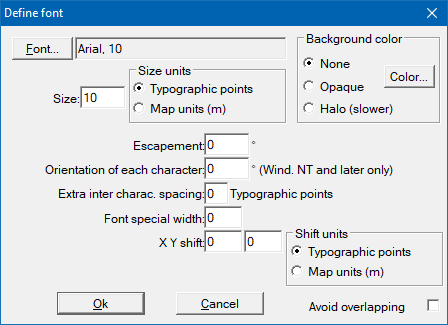  In the following example, a text with a background halo is shown first. In the second figure (from left to right) an escapement of 15║ has been applied. In the third figure, an orientation of 15║ on each character has been applied, without any escapement of the font. In the figure below left, an extra inter characters spacing of 10 typographic points has been applied and in the lower right figure a font special width of 8 has been applied. 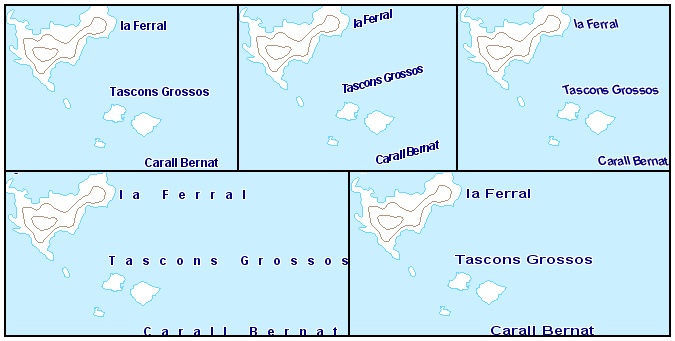 Specification of the properties of a font in the MiraMon symbolization tables within the FONT / FONT_ENTIT field (for example "/NArial/H12/B") As it was established in version 4, a font is specified through a text string that can be in a REL or MMM file if applies to the entire layer, or in a field of a font symbolization table, etc. The format of this string is constituted by a series of labels that are referred to the different font properties. Each property is specified with a split bar (/) followed by a characteristic letter (sensitive to the case: do not use capital and lower case letters indifferently) and then, if applicable, the value that the property takes. The list of supported properties is the following:
A. Properties with mandatory value (if indicated, must be followed by a value) B. Properties with optional value C. Enable properties D. Other properties Additionally, and although it is not a characteristic of the font itself, the following properties can be added, in this case preceded by a 3-letter label: In addition, when the size is indicated in typographic units, the representation on-screen is exactly the same as is on-paper (as long as the indication of the size of the user monitor has been set). Note: All the notation described in this section can also be used in the description of the texts symbolization in .rel and .mm files. 3.2 Dynamic labelingDynamic labeling of arc and line files Dynamic labeling of arc and line VEC files is allowed. Thus, any field of any table in the database associated with an arc file or attribute of a line VEC file can be shown as a text running next to the arc. This functionality allows to establish the range of scales within which the texts of the lines has to be displayed (regardless of the range of scales of the layer itself and highly recommended to avoid an excess of texts in general views), as well as to censor texts of a excessive length in relation to its corresponding arc/line; this last functionality allows to indicate values such as 0% (texts will always be drawn independently of the length of the arc), 100% (texts will be drawn when the arc is at least as long as the text), 200% (texts are only drawn if the arc is at least twice as long as the text), etc; this behavior allows avoiding the labeling of too short arcs and the overlapping of texts. It is also possible to establish a distance to the arc, above or below, and even set the text "crossed" by the line, as is traditional in the contour lines; this parameter is also indicated in %: a value of 0 indicates that the text is above the line, 50% indicates that an extra text box is left separating it from the line, 100% indicates that between the text and the line a space corresponding to a text line is left, etc; if a negative displacement is indicated, the text moves down: if the offset is -50% (half text box) the text is "crossed" by the line, if it is -100% it is located entirely below the line, etc. 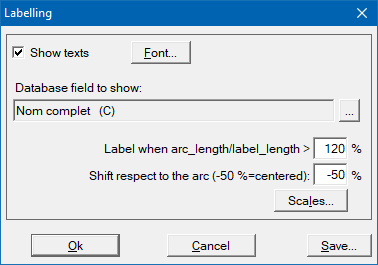 The text is oriented intuitively according to the orientation of the line itself and, in case of being near to the edge, estimates if it changes the band of the arc to make it visible. The algorithm studies the different segments of the line and chooses the longest as representative to guide the text, but if the segments are very short it gradually generalizes the line to find a satisfactory direction. In each attempt it positively weighs the centrality of the segment in the context of its arc as well as the length of the chosen segment. If an arc enters and leaves the visualization or printing field, it is labeled as many times as it appears (unless it ever occupies too little and is censored by one of the other parameters). It is possible to indicate "Avoid overlapping" so that the program tries to avoid collisions between the tags. The text can be symbolized using practically all the properties that apply to the points, with the exception of the inclination and orientation and the XY displacement, which have no sense in the lines that are decided according to the arc/line to be labeled; in particular, remember that the text can be set in typographical units or in map units (it will become smaller when it moves away). Dynamic labeling of polygon files Dynamic labeling of polygon files (both POL and VEC) is allowed. Thus, any field of any table in the database associated with a POL file or attribute of a polygons VEC file can be displayed as a text within the polygon. This functionality allows to establish the range of scales within which the texts in the polygons must be displayed (independently of the scale range of the layer itself and highly recommended to avoid an excess of texts in general views), as well as to censor the texts of a excessive area in relation to its corresponding polygon; this last functionality allows to indicate values like 0% (the texts will always be drawn independently of the polygon area), 100% (the texts will be drawn when the polygon occupies at least as much surface as the text), 200% (the texts are only drawn if the polygon is at least double the surface area of the text), etc; this behavior avoids labeling too small polygons and obtaining overlapping texts. 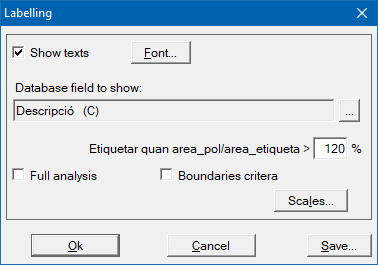 The heuristic label placement follows a sophisticated system, the main characteristics are:
The text can be symbolized using almost all properties that apply to points, in particular, remember that the text can be set in typographical units or in map units (it will become smaller when it moves away). When the content of the field that is being used as an attribute of the object for dynamic labeling in the process of digitizing a layer (of arcs/lines or polygons) symbolized with dynamic labeling is changed, the attribute change is immediately reflected on-screen.
As usual, if the first symbolization of a field does not have the corresponding symbolization table, it is usually more practical with MiraMon to make a first table through the activation of the "Automatic" mode. In this case the program works as usual, but with the following features: The field that indicates the font has a categorical treatment: In this case, from the available properties, the color font is possibly the one the user wants MiraMon to change; on the other hand, with a categorical treatment the program cannot deduce which categories the user wants to assign large or small texts, for example. Thus, the program will generate a table in which the last constant font loaded in the layer will be taken as the pattern (Arial 10 if none has been specified) and generate as many records as are derived from the projection of the field, coloring them with the typical thematic palette used in automatic categorical symbolization, plus the record for NoData, which will be symbolized with the internal variable of the MiraMonFontObjectesSenseAtribut (Arial 10 bold underlined cursive centered). The field that indicates the font has a continuous quantitative treatment. In this case, from the available properties, the height of the font is possibly the one the user wants MiraMon to change. Thus, the program will generate a table in which the last constant font loaded in the layer will be taken as a pattern (Arial if none has been specified) and will work with the same heuristic as in the other cases, trying to deduce whether it is appropriate to apply a direct, linear, etc, assignation, starting from 10 records to which will assign progressively higher fonts (6,8,10,12,14,16,18,20,22,24), plus the record for NoData, which will be symbolized with the internal variable of the MiraMonFontObjectesSenseAtribut (Arial 10 bold underlined centered italics). If previously a different number of symbols has been assigned (for example because it has been rehearsed a categorical symbolization or because the user has varied the number through the advanced button, this will be the number of records that the continuous quantitative automatic mode will assume. In both cases, the TEXT_FONT field created has a width of 45 characters, which is considered enought to contain a representative text such as "Barcelona" or "Sant Cugat". The field is filled with the same value as CLAUSIMBOL but as explained before, the user can change this value if it suits him. If modifications are needed in the generated automatic symbolization table, it can be saved from "File | Save palette or symbolization table" and make them with MiraDades. 4. Icons symbolization tablesAn icons or symbols symbolization table is a table that defines, for a given number of points, the symbol associated with each of them. The symbol tables can represent an unlimited number of symbols. The symbols of point type entities, in addition to EMF and WMF files, can also be JPEG, PNG, BMP and GIF (even mixed in the same symbolization table). However, there are graphic limitations of these formats if they are to be represented at a resolution that evidences their raster nature. They are only applicable to topologically structured files. By default, the option to use symbols to represent points is disabled, so that points are displayed by white circles with a black outline. The default radius of these points is given by the "RadiPnt" parameter of the MiraMon.par file, although it can be changed through the corresponding box: a value of 0 avoids the visualization of the points, while the value 1 or 2 is adequate in most cases. In point files it is also possible to choose representing the radius based on a field of the database. This is useful, for example, to represent data such as number of inhabitants of municipalities associated with points, or to represent the coverage obtained in a forest inventory. In this case, the field to be used as well as the minimum and maximum radius to scale the representation must be indicated. Through the "Symbology" button in the Visualization of POINTS vectors dialog box several options for the symbols can be selected: 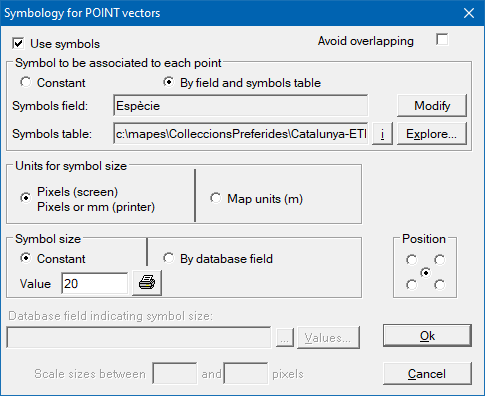
Remember that if the insertion point itself is not wanted to be shown, a radius of size 0 in the Visualization of POINT vectors box can be indicated. If in the symbology box (icons) it is symbolized using the same field (typically a numerical field of small integers 1,2,3 ...) to indicate both different relative sizes of the symbols and different symbols (indicated in the table of symbolization of the symbols through the corresponding field CLAUSIMBOL (or NOM_SIMBOL)), it will be observed that in the legend the two criteria are collapsed and the different symbols are seen in size gradation. Several videotutorials have been developed regarding MiraMon symbolization, which can be consulted at MiraMon symbolization. |