
|
Tools Menu |
General conceptsThe Tools menu options mostly run MiraMon support applications, programs that allows performing many analyses, geometry, etc. operations with rasters and vectors. Some of these applications are grouped by topic (file maintenance, spatial organization, etc). In some cases, the same application is included in two or more topic groups. It should be noticed, however, that some MiraMon support applications are found in other menus, such as the import and export applications, which are found in the File menu, or the topological structuring applications, which are found in the Edit menu. In order to consult synoptic information about the functionalities of all MSA, the menu from which they can be opened, etc, go to MiraMon Support Applications (MSA). Within this menu is also included the access to the Universal Geospatial Metadata Manager (GeM+), which allows the user to create, view and edit the metadata associated with a given cartographic base in MiraMon format. On the other hand, access to the Notepad and the Windows Scientific Calculator has also been incorporated into the Tools menu, to be useful in several processes with rasters and vectors and because it exemplifies that it is possible to provide access to other applications from the MiraMon menu. For more information on customizing the menus, see the Menus section of the Parameter Configuration explanation included in the Help menu.
Metadata ManagerThe Universal Geospatial Metadata Manager (hereinafter GeM+) is an application for Windows platforms, which allows the user to create, view and edit the metadata associated with a given cartographic base in MiraMon format. It is one of the MiraMon Support Applications. This application can be launched from MiraMon itself (Tools | Metadata manager) or executed independently. For more information, please consult the documents collected in the Universal Geospatial Metadata Manager section. 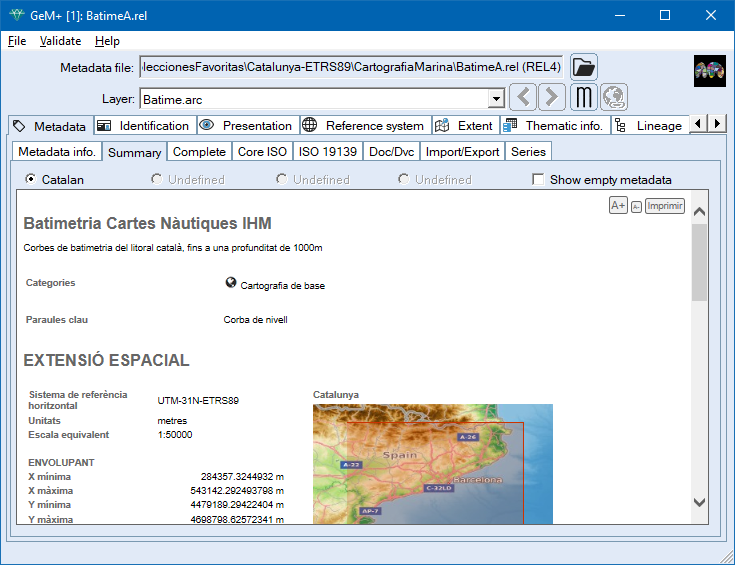
Raster, vector & tables calculator/reclassifierThis application allows performing reclassifications and mathematical and logical operations, simultaneously, on layers of any type (rasters, structured vectors and unstructured vectors), in any number and in any directory. For more information regarding the operation of the program, syntax, etc, please consult CalcImg: Layers and fields Calculator/Reclassifier: Mathematical and Logical Analysis. 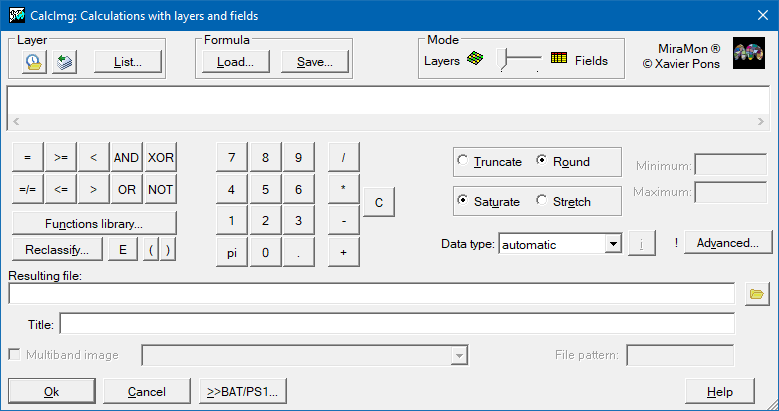
Analytical combination of layersThis application analyses and/or performs a spatial combination of two raster layers, a raster layer and a vector layer or two vector layers. For more information regarding the operation of the program, syntax, etc, please consult CombiCap: Analytical combination of raster and vector layers. 
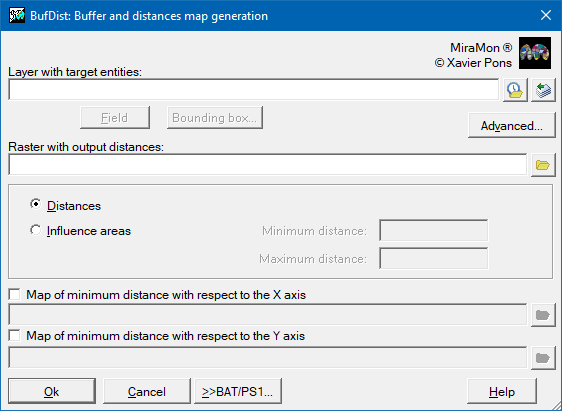
Buffer and distances map generationThe application allows the creation of both continuous distance maps (raster result) and influence maps (buffers) at a specified distance from the target entities (raster and vector result).
For more information regarding the operation of the program, syntax, etc, please consult BufDist: Influence areas (buffers) and distance maps generation.
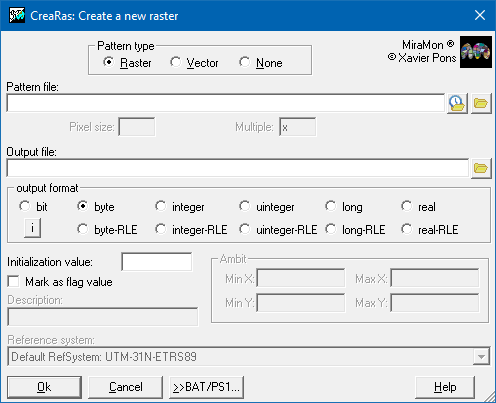
File maintenanceThe file maintenance section includes a set of applications that allows the user to manage, modify and optimize files of different formats and perform operations of file compression and uncompression, file conversion, label generation, polygon emancipation, etc: Compression and uncompression of MMZX/MMZ filesThe application compresses and uncompresses both MMZ files (compressed MiraMon files) and their standardized evolution, MMZX files. The MMZX and MMZ formats allow to compress all files related to a map (MMM), such as linked thesaurus, or files related to a layer (POL, IMG, etc) in a single file. These files can be distributed over the Internet, email, etc, with all their parts (data, metadata, symbolization, etc). In addition to their interest in the distribution of geographic information datasets that contain all kinds of data (vector, raster, geoservices, tables, etc), the MMZX/MMZ files are the best option for preservation of cartographic documents for general archiving purpose, compilation of documentation related to legal process, etc. For more information regarding the operation of the program, syntax, etc, please consult MMZ: Compression and uncompression of MMZX/MMZ files (diffusion, preservation, etc; limited version). 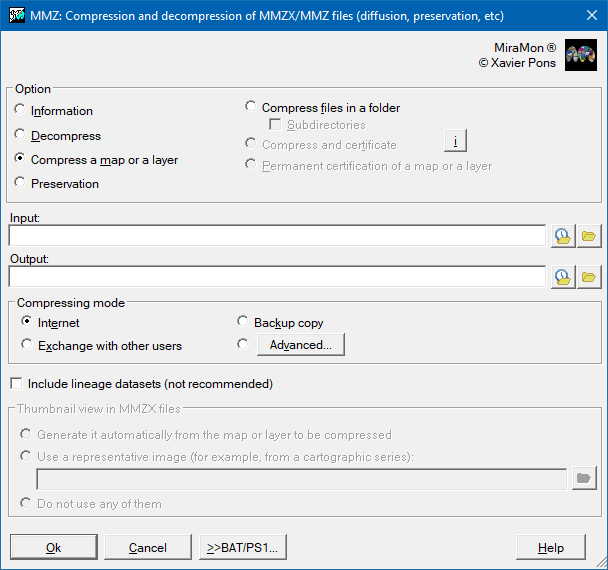 Create a new rasterThe application creates a new raster (or a grid on a VEC file) from the coordinates and pixel size given in a file, that is used as a pattern. This file can be of type IMG, VEC, POL, ARC, PNT or NOD. It is also allowed to enter these data manually without using a pattern file. For more information regarding the operation of the program, syntax, etc, please consult CreaRas: Create a new raster.
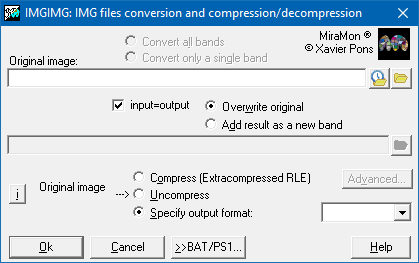
 IMG files conversion and compression/uncompressionThe application is used to compress and uncompress raster files and for converting between IMG formats. For compressions/uncompressions between IMG and JPEG formats use JPEGIMG. To uncompress JPEG2000 formats (.jp2 or .j2c) please use J2KIMG. For more information regarding the operation of the program, syntax, etc, please consult IMGIMG: IMG files conversion and compression/uncompression.
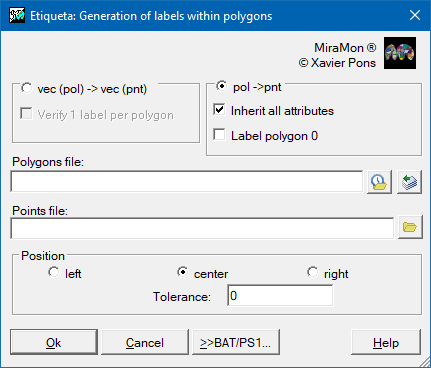
 Generation of labels within polygonsThe application allows the generation of points that are polygon labels from a POL file or a VEC file of explicit polygons. The new labels may or may not inherit the pre-existing attributes of the polygons and have the same order as the original polygons. The application allows you to place a label on polygon 0 (the outer polygon that surrounds all the others) or not. For more information regarding the operation of the program, syntax, etc, please consult Etiqueta: Generation of labels within a polygon.
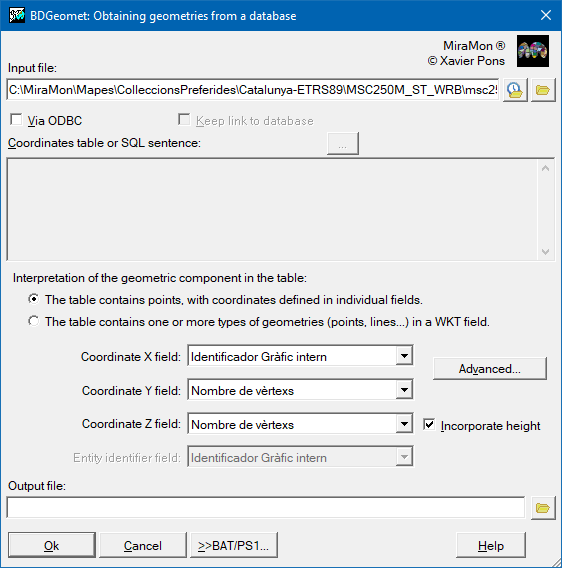
 Obtain points from DBF table, Access, etcThe application generates vector files from a geographic locations field of point type (X,Y) or from a WKT geometries field in a table of any database (local or remote). In the case of a geographic locations field of point type, the output file is generated topologically structured in MiraMon's PNT format. For more information regarding the operation of the program, syntax, etc, please consult BDGeomet: Obtaining geometries from a database (local or remote).
 Automatic generation of maps and cartographic seriesThe application creates MiraMon maps (MMM format) rapidly from the command line. An existing map may be used as a template. This program is useful for automatically generating map series (with many sheets, typically map series such as "Topographic 1:50000"). For more information regarding the operation of the program, syntax, etc, please consult CreaMMM: Automatic generation of maps and cartographic series.
Emancipate polygons from arcsThe application generates a duplicate of the polygons file linked to a new arcs file, or can generate a simple emancipation by generating a specific arcs file while maintaining the original polygons o file. In both cases, the original layer has been obtained by extracting only those arcs indispensable for the reconstruction of each polygon. For more information regarding the operation of the program, syntax, etc, please consult Emancipa: Extraction of the minimum base of arcs for a given polygon file.
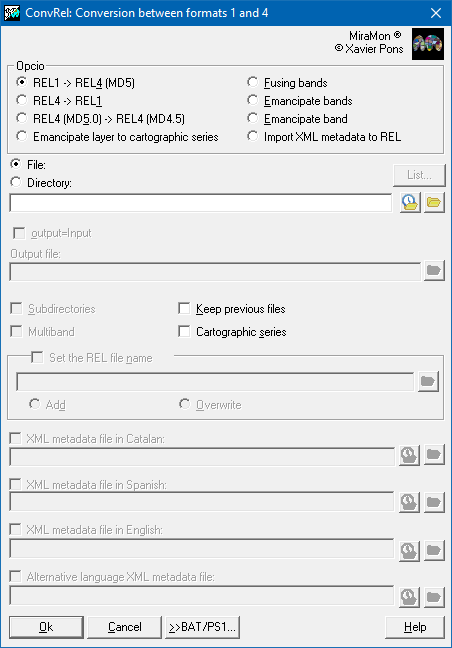
 Conversion of MiraMon layers from format 1 to format 4The application transforms the links between tables, metadata and symbols from older versions to the 4/5 version. It also permits the user to return to older versions of the program with more limited features. For more information regarding the operation of the program, syntax, etc, please consult ConvREL: Conversion of layers between MiraMon formats 1 and 4.
 Convert or mark ANSI/OEM/UTF-8Because of the high diversity of characters existing in the different languages of the world, of the necessity to write down special symbols, and also due to the own computer science history, different sets of characters have been used in different countries and under different operating systems. Consequently, it is usual to find strange characters, for example when reading with a plain text editor under a Windows environment (such as notepad), or a text created with a plain text editor from another operating system, such as EDIT MS-DOS previous editor. The application allows several options:
For more information regarding the operation of the program, syntax, etc, please consult ANSIOEM: Character set conversion or marking in ANSI (Windows), OEM (DOS) or UTF-8 files.

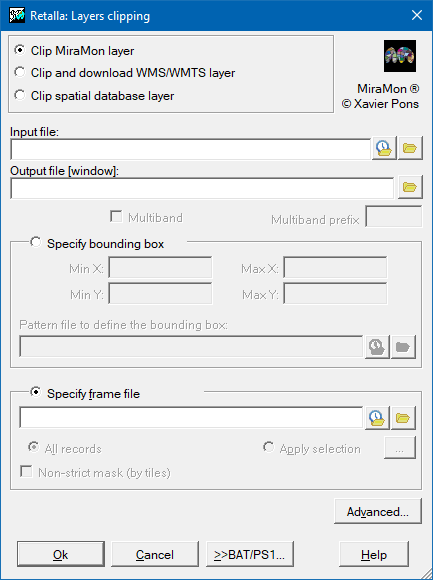
Spatial data managementThe spatial organization section includes a set of applications that allows the user to manage, modify and combine spatial data within a geographic environment. These tools are essential in GIS work and geospatial operations, as they allow the user to work with layers and vector or raster files in a flexible and efficient way. Layer clippingThe application allows clipping IMG, JPG, WMS, and structured and not structured vectors.
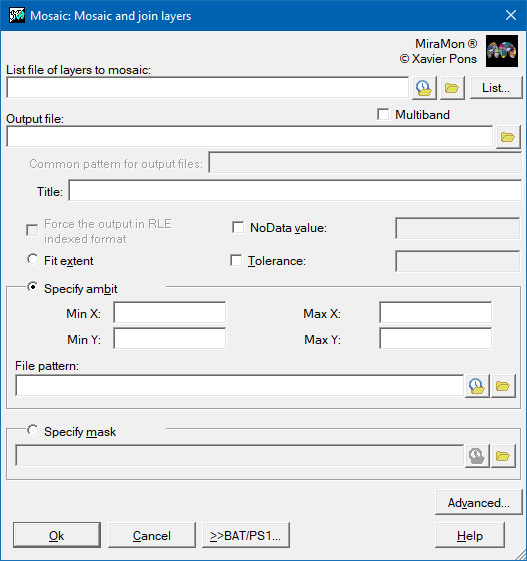
 Mosaic and join layersThe application generates a new layer from the union of the original layers that cover a specific area, such as a set of sheets of a specific cartographic section. For more information regarding the operation of the program, syntax, etc, please consult Mosaic: Mosaic and join layers.
 Join two or more vector filesThe application allows two or more MiraMon vector files into a single file without taking any topological consideration. For more information regarding the operation of the program, syntax, etc, please consult UnirVec: Joining two or more vector files.
 Erase micropolygonsThe application allows the elimination of micropolygons, defined as small objects, sometimes elongated, and often without a thematic label. That is why they have a small area, a small area/perimeter ratio (large perimeter and small area) and that they have not been labeled. This application incorporates these three criteria and an additional criterion to be able to mark a polygon as eliminable through a logical field in the main polygon database. For more information regarding the operation of the program, syntax, etc, please consult MicroPol: Erase polygons and micropolygons of a polygon or categorical raster layer.
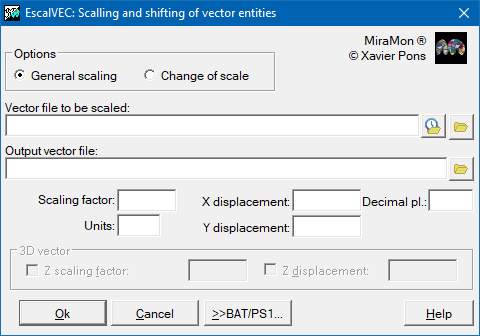
   Scalling and shifting of vector entitiesThe application performs a change of scale and/or a shift of vector files in non-structured VEC format. It also changes map coordinates to paper coordinates as a prior step for exporting some drawing packages. For more information regarding the operation of the program, syntax, etc, please consult EscalVEC: Vector entities scalling and shifting.
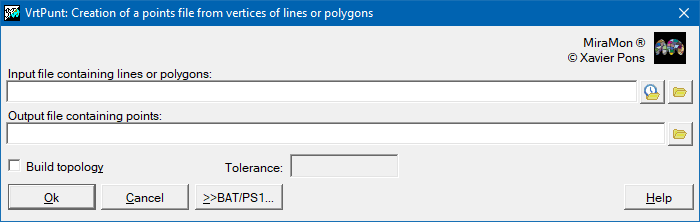
 Vertices from lines or from polygons to pointsThe application creates a file containing points from extractions of from all lines or polygons vertices taken from a file. For more information regarding the operation of the program, syntax, etc, please consult VrtPunt: Creation of a points file from vertices of lines or polygons.
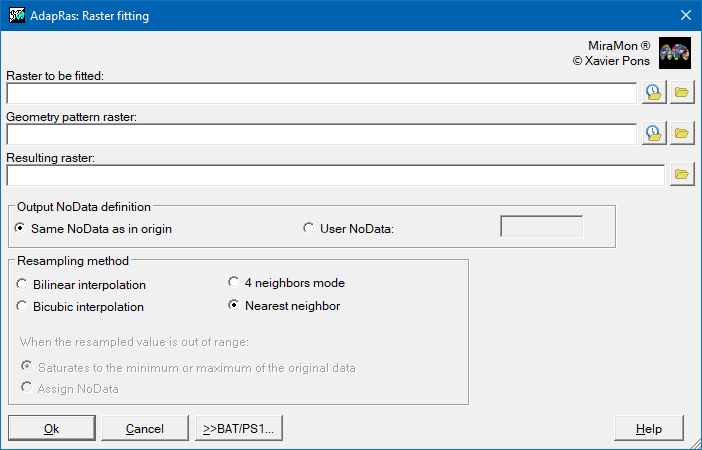
 Raster fitting to another raster (extent and cell size)The application fits a raster file according to a geometric pattern of another raster file, even when the pattern raster has a wider bounding box than the raster to be adapted. For more information regarding the operation of the program, syntax, etc, please consult AdapRas: Raster fitting to another raster (extent and cell size).
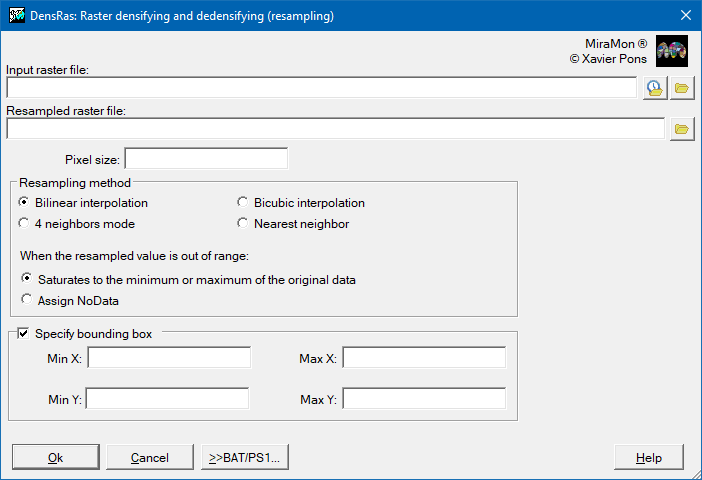
 Raster densifying and dedensifyingThe application changes the cell side of a raster (densifies or dedensifies it, as appropriate), without exceeding the bounding box of the original raster, and allowing, if necessary, a change of the origin grid. The procedure operates using one of the following four resampling methods: nearest neighbor, 4-neighbor mode, bilinear interpolation, or bicubic interpolation. In these last two options (bilinear interpolation and bicubic interpolation), when the value resulting from the resampling is a value outside the range of values of the original raster (lower than the minimum value or higher than the maximum value of the original raster), the user is allowed to select between to saturate the resampled value to the minimum value of the original raster (or maximum as appropriate) or assign NoData. On the other hand, the program makes a careful treatment of the NoData value (it does not consider it in the resampling: for example, if one of the 4 neighbors at the position of a cell in the new raster is NoData and the criterion is the mode, this mode will be calculated considering only the 3 neighbors with data). For more information regarding the operation of the program, syntax, etc, please consult DensRas: Raster densifying and dedensifying (resampling).
 Change pixel size on rasters (multiples)The application changes a raster pixel side without changing its origin. Pixel side change can be done either by contraction or expansion of the original pixels. For more information regarding the operation of the program, syntax, etc, please consult CanviRes: Changing raster pixel side (exact multiples).

Alphanumerical databasesThe spatial organization section includes a set of applications that allow operations such as viewing and editing tables, managing and maintaining records, selecting subsets of vector entities, or calculating statistics for fields and records groups. These functionalities allow information to be analyzed and processed in a structured way, guaranteeing its coherence and reliability for different areas of application.
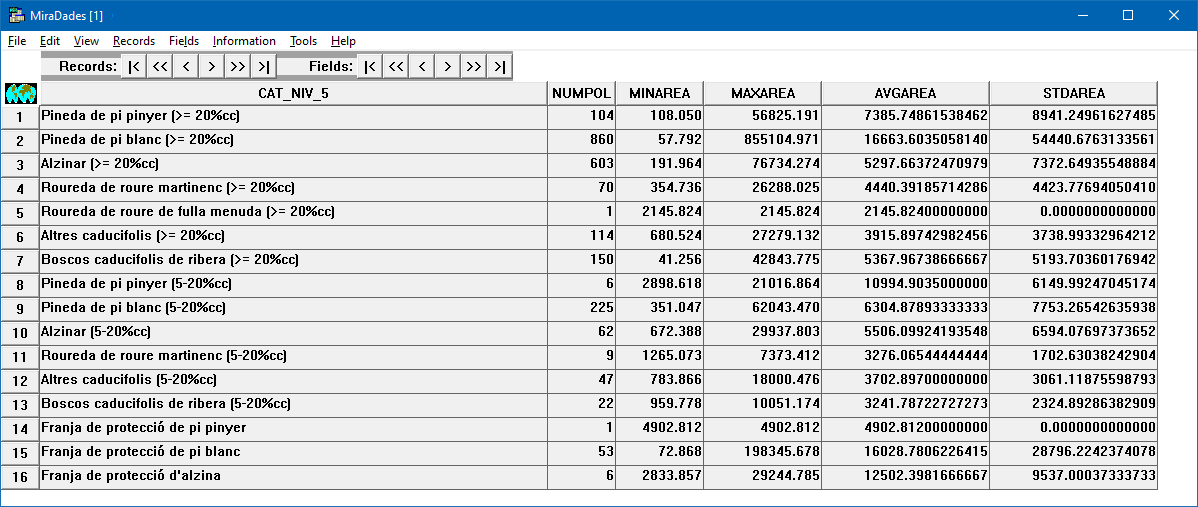
View and edit Databases TableMiraDades is a database table viewer and DBF table editor. It is a Windows application that is part of the MiraMon development. The application is easy to use because it uses a display similar to that of spreadsheet viewers where the rows are the table records and the columns are the table fields. With MiraDades it is possible to edit database contents, restructure fields or records, sort, join and perform the basic table operations needed in a geographical information system. For more information regarding the operation of the program, syntax, etc, please consult MiraDades: View and edit Databases Tables.
 Databases Tables management and maintenanceThis application consists of a set of tools and procedures for editing, revising, updating, etc different elements (table structure, fields and records) of databases and tables. It is especially suitable for automating some of the procedures that are usually carried out interactively with the MiraDades table manager, but it also includes options that are exclusive to this application. For more information regarding the operation of the program, syntax, etc, please consult GestBD: Database Tables management and maintenance.
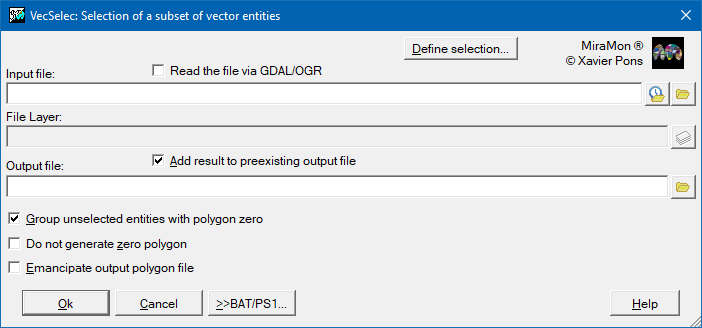
 Selection of a subset of vector entitiesThe application selects a subset of graphical objects, whether points, arcs, nodes, polygons or groups of polygons, from one file and copies them to a second file in the same format. For more information regarding the operation of the program, syntax, etc, please consult VecSelec: Selects a subset of graphical vector objects.
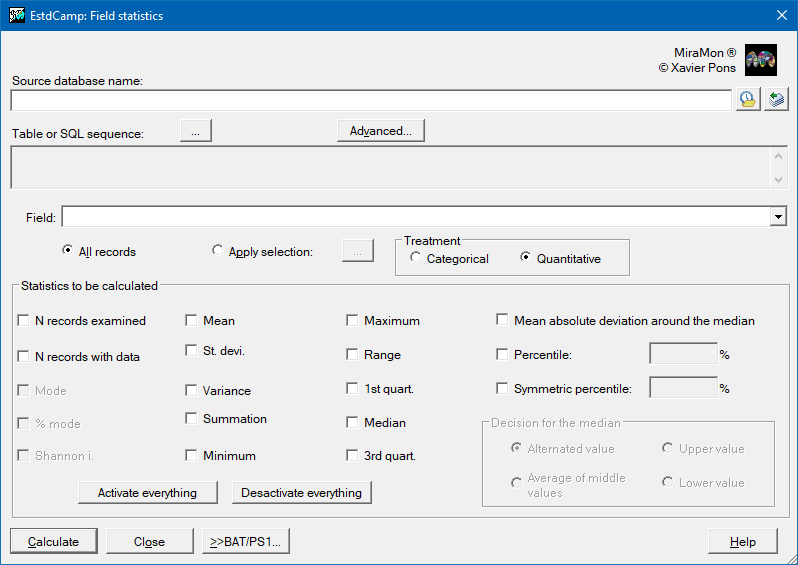
 Field statisticsThe application does statistical calculations on a table field. This can be any physical table or query such as the associated with a graphic layer from its corresponding REL file, and it can also be an individual DBF table or a table or SQL query via ODBC of a MDB, Oracle, etc, database. For more information regarding the operation of the program, syntax, etc, please consult EstdCamp: Statistics of a table field or database query.
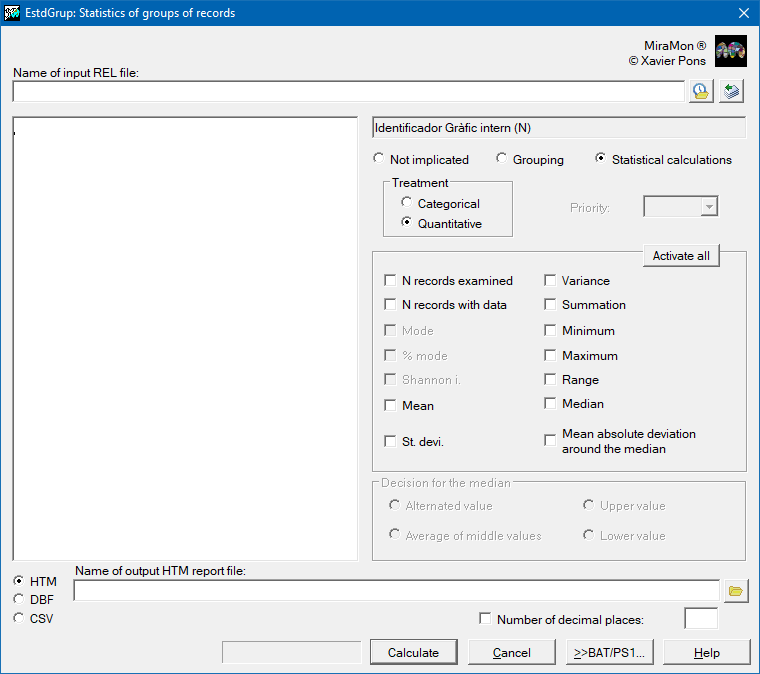
 Statistics of record groupsThis application carries out statistical calculations for one or more fields of a database (usually linked to a structured vector layer). These statistics are calculated and classified according to groupings defined by the user. For more information regarding the operation of the program, syntax, etc, please consult EstdGrup: Fields statistics by grouping records according to values present in other fields.
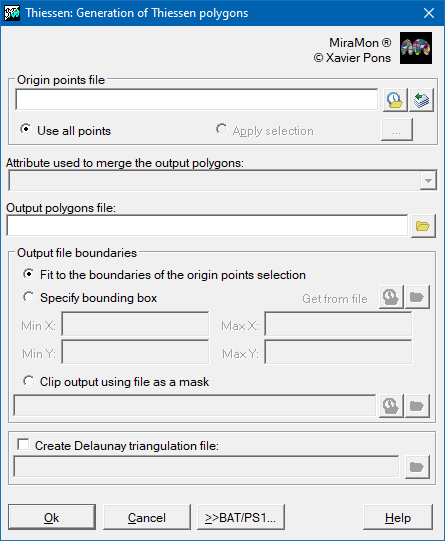
Terrain interpolation and analysisThe section on terrain interpolation and analysis groups together applications intended to model, represent and study the physical characteristics of a surface based on geospatial data. These operations allow estimating values at unknown points, analyzing the morphology of the relief and generating derived products that facilitate the interpretation of the environment. Thiessen polygons generationThis application generates, from a layer that contains a set of point-type vector entities, a layer of polygons that will contain the corresponding Thiessen polygons. Thiessen polygons result from generating a partition of space into areas of proximity around the provided points, where each resulting polygon defines the closest area to each point. Thus, Thiessen polygons are the method typically used to interpolate categorical data collected at sampling points (for interpolation of quantitative data collected with sampling points, use InterPNT: Interpolation from point data, lidar). For more information regarding the operation of the program, syntax, etc, please consult Thiessen: Generation of Thiessen polygons.
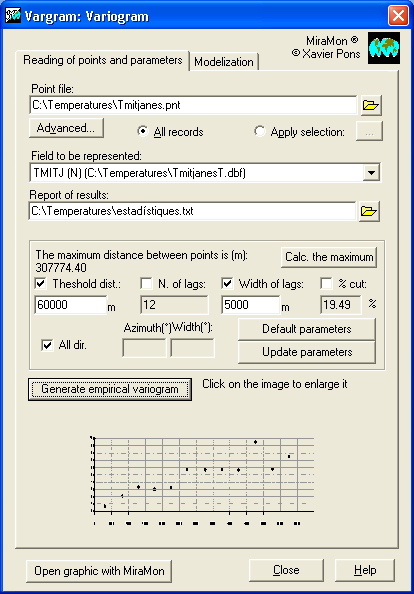
 Variogram representation and modelingThe application allows to present and model the so-called semivariogram, a spatial pattern that describes the correspondence between the semivariance and the distance. The semivariance, half of the variance, is a measure of the dispersion of the variable with respect to its expected value and is calculated as the sum of the squares of the deviations with respect to the mean. The semivariogram (or variogram in a more general and conceptually equivalent way) allows to analyze the spatial behavior of a property or variable over the study area and its modeling constitutes a key element in the geostatistical interpolation process (kriging). For more information regarding the operation of the program, syntax, etc, please consult Vargram: Variogram representation and modeling.
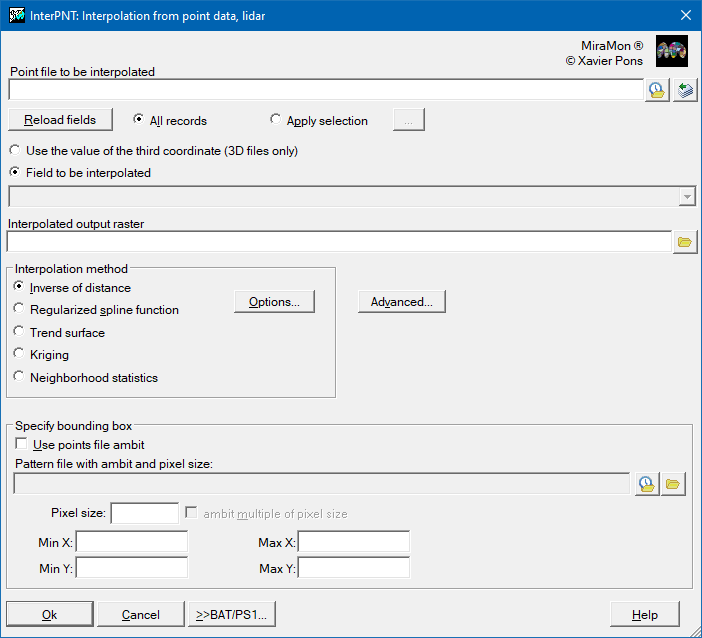
 Interpolation from point data, lidarThe application generates a raster in which each cell value is obtained by interpolation between the values in a numerical field of the database of a points file, or the third coordinate in the case of 3D files (where Z can be topographic, but can also be another variable, such as temperature, concentration of a pollutant, etc). For more information regarding the operation of the program, syntax, etc, please consult InterPNT: Interpolation from point data, lidar.
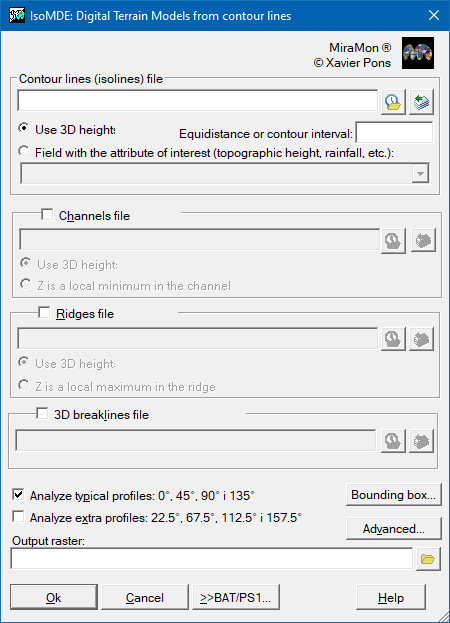
 Interpolation from contour linesThis application allows digital terrain models (DTMs) to be generated from all sorts of isolines, and may use other additional information like lines showing valleys, hillcrests, etc. Although the most typical use of IsoMDE is for obtaining Digital Terrain Models (DTMs) that describe the topography based on conventional contour lines, the program allows any quasi-continuous surface to be generated from any sort of isoline. For example, IsoMDE can be used to interpolate between isotherms, isobars, isochrones, isobaths, etc. to obtain respectively quasi-continuous raster layers of temperature, pressure, access times, bathymetry, etc. For more information regarding the operation of the program, syntax, etc, please consult IsoMDE: Generate Digital Terrain Models from contour lines.
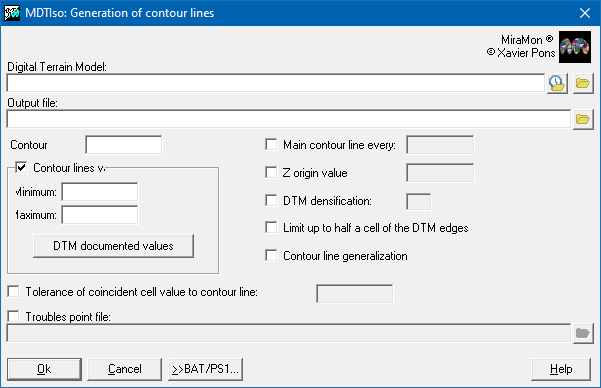
 Contour line generation from DTMThe application allows generating contour lines (also known as contour lines or isopleths) from a digital terrain model (DTM) (for instance elevation, rainfall, evapotranspiration, pollution, etc). The algorithm works, internally, in two stages:
For more information regarding the operation of the program, syntax, etc, please consult MDTIso: Generation of contour lines from DTM.
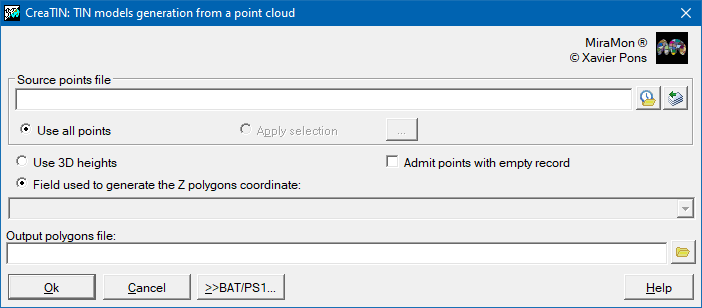
 TIN models generationThe application This application allows generating a triangulated irregular network (TIN) from a file of points. For more information regarding the operation of the program, syntax, etc, please consult CreaTIN: TIN models generation from a point cloud.
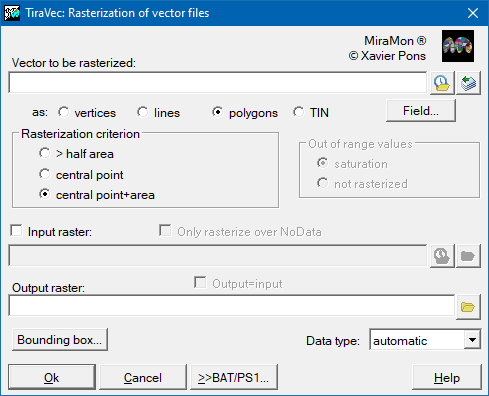
 TIN rasterizationThis application takes a vector point file, a line/arc file, a polygon or node file (whether structured or not) and rasterizes it using an existing or new raster. Although the application supports all MiraMon vector formats it is recommended that structured formats are used in the case of polygon files since these allow holes within polygons and are free of overlapping polygons(except for any non topological groups that they may contain). Moreover the structured vector formats allow linking to a database, which in turn allows a greater degree of control over the raster attributes and the automatic generation of categories. If an unstructured polygon file is rasterized then where superpositions occur the value of the last polygon prevails. For more information regarding the operation of the program, syntax, etc, please consult TiraVec: Rasterize vector files.
 DTM densifying and dedensifyingThe application changes the cell side of a raster (densifies or dedensifies it, as appropriate), without exceeding the bounding box of the original raster, and allowing, if necessary, a change of the origin grid. The procedure operates using one of the following four resampling methods: nearest neighbor, 4-neighbor mode, bilinear interpolation, or bicubic interpolation. In these last two options (bilinear interpolation and bicubic interpolation), when the value resulting from the resampling is a value outside the range of values of the original raster (lower than the minimum value or higher than the maximum value of the original raster), the user is allowed to select between to saturate the resampled value to the minimum value of the original raster (or maximum as appropriate) or assign NoData. On the other hand, the program makes a careful treatment of the NoData value (it does not consider it in the resampling: for example, if one of the 4 neighbors at the position of a cell in the new raster is NoData and the criterion is the mode, this mode will be calculated considering only the 3 neighbors with data). For more information regarding the operation of the program, syntax, etc, please consult DensRas: Raster densifying and dedensifying (resampling).
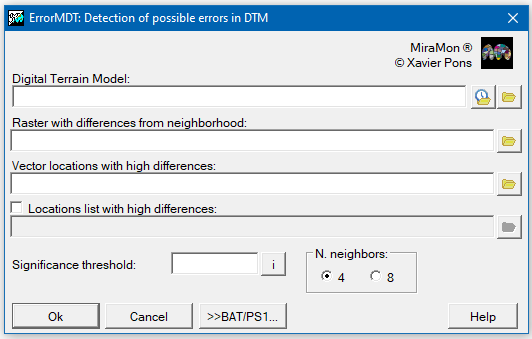
Detection of possible errors in DTMThis application searches for locations in a Digital Terrain Model (MDT) that contain candidate values to be considered errors. The program compares the value of each cell with the result of a local interpolation of its 4 or 8 neighbors. If this difference is high, higher than the Student's t indicated, it is marked as a suspected error location. The program generates a model with the differences in each cell and a non-structured point vector (VEC) with the locations with the possibility of being wrong. It is also possible to generate a report, in the form of a text file, which includes the list of these candidates. The verification algorithm simplifies the columns and extreme rows of the raster (column 0, row 0, last column and last row). For more information regarding the operation of the program, syntax, etc, please consult ErrorMDT: DTM error detection.
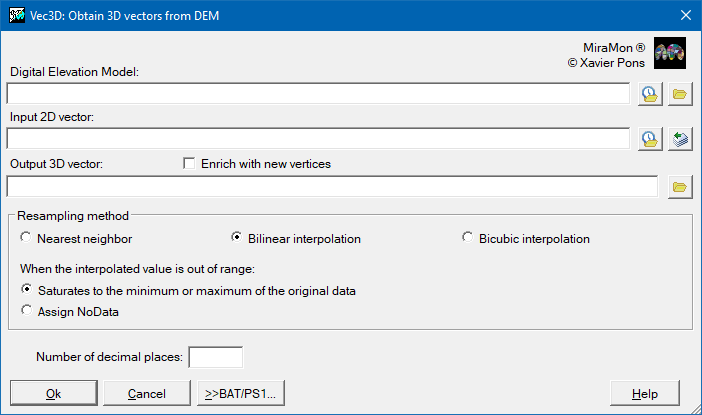
 Obtaining 3D vectors from DEMThe application incorporates the third dimension into unstructured vector files (VEC) or PNT or ARC files based on the Digital Elevation Model (DEM) of the same area. The POL and NOD files acquire the third dimension when the linked ARC files are ARC 3D, so to convert a POL file to 3D, the Vec3D must be run on the corresponding ARC file (located in the same directory as the POL file). For more information regarding the operation of the program, syntax, etc, please consult Vec3D: Obtain 3D vectors from DEM.
 Topographic profile generationThe application allows generates topographic profiles for a specific itinerary (represented by an ARC file with the restrictions that are specified below) using a Digital Elevation Model (DEM). A graph in MMM format is automatically generated with the following elements: the profile itself, labels, mesh, boxes with titles, etc, that users may later edit or adapt according to their own preferences. For more information regarding the operation of the program, syntax, etc, please consult Perfils: Generate topographic profiles.
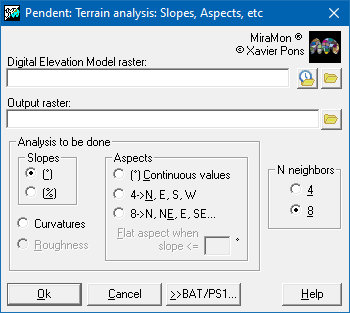
 Compute slopes, aspects, etcThe application calculates, based on a Digital Elevation Model, several Digital Models (slope: MDP, aspect: MDO, etc) which are derived from the elevations, in order to describe and to characterize the relief. The application can produce the following Digital Models:
For more information regarding the operation of the program, syntax, etc, please consult Pendent: Terrain analysis: Slopes, Aspects, etc.
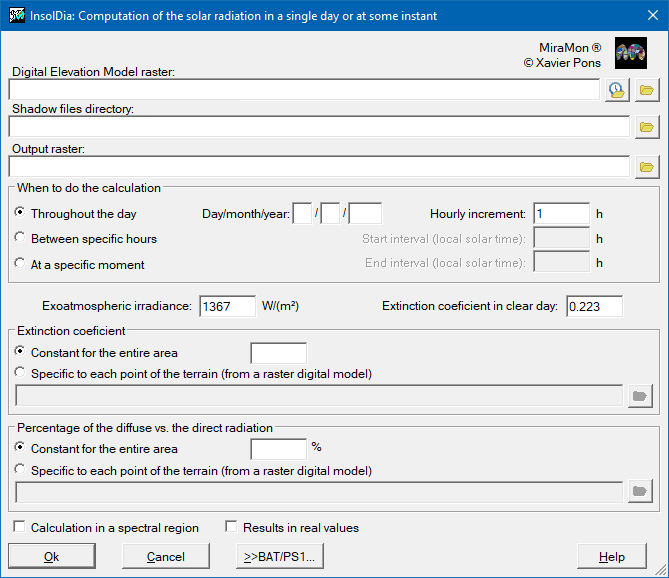
 Compute solar radiationThe application calculates the incident solar radiation (in units of energy, not power) at each point on the ground during a given day of the year. It also allows to make the calculation in a time interval throughout the day (not all day) and instantaneously at a specific moment of the day. To make these calculations, this application uses a Digital Elevation Model (DEM). In addition to solar irradiance, atmospheric transmittance, angles of incidence, projected shadows, distance from the Earth to the Sun and other parameters specified later, the application takes into account the position of the Sun in user-defined time intervals (hourly, for example, except in the instant case, where the interval is not used). For more information regarding the operation of the program, syntax, etc, please consult InsolDia: Computation of the solar radiation in a single day or an instant.
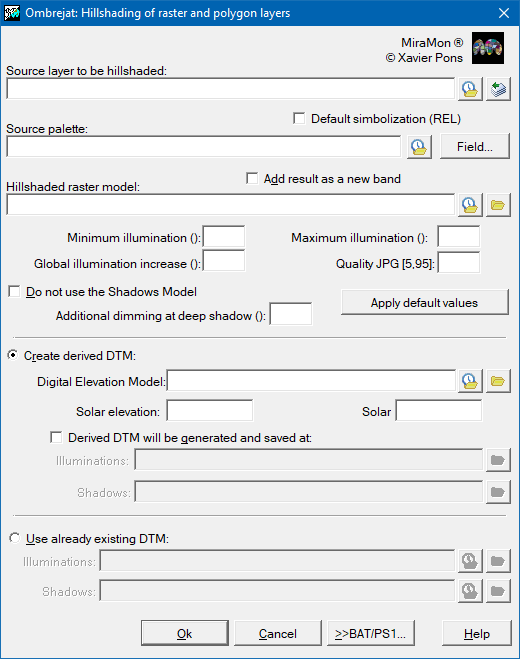
 Hillshading maps generationThis application is a tool to obtain shadowed images (through light gradation) according to the relief and the position of the Sun. The localization of the Sun is determined by the elevation angles (in degrees) with respect to the horizon and the azimuth in relation to the North in clockwise sense (with 0¼ indicating the North). Specification of these angles will be required when generating the model derivations of DEM (Digital Elevation Model). These model derivations are the Digital Illumination Model, which calculates the cosine of the angle of incidence, and the Digital Shadow Model which determines the solar elevation angle from which each point of the terrain gets direct light from the Sun. These models can be pre-calculated with the corresponding applications: Illum and Ombra. In any of the cases, from the DEM, the application can generate temporarily the necessary model derivations and delete them when finished, or keep them for later usage. It has to be born in mind that the calculation of the Shadow Model can become a long process that needs large memory resources, and therefore, it is possible to not use this model. Without it, an acceptable result will be generated, although of a lower quality than when this factor is taken into consideration.
For more information regarding the operation of the program, syntax, etc, please consult Ombrejat: Hillshading of raster and polygon layers.
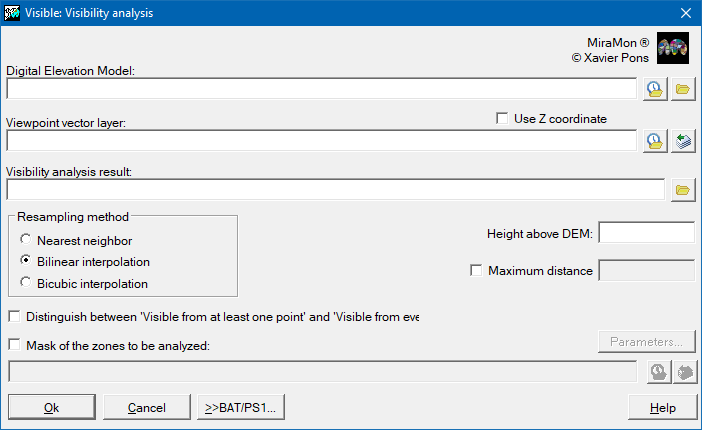
 Visibility analysisThe module of visibility analysis of MiraMon determines, through the Digital Elevation Model (DEM), which pixels are visible and which are not, via a set of observers or viewpoints. In this version, the observers have to be specific objects in structured PNT format; they can be 3D objects, in which case the height will be known (it is possible that they be elevated from the ground, for example in a tower), or 2D, when the height will have to be determined through provided DEM. The calculation of this height and the heights of the points that determine the topographic profiles can be done by nearest neighbor, bilinear interpolation or bicubic interpolation. A complementary height, 3D or calculated, can be added to the height of the observer (equal at all the points), to elevate the observers and obtain a better visual field. For more information regarding the operation of the program, syntax, etc, please consult Visible: Visibility analysis.
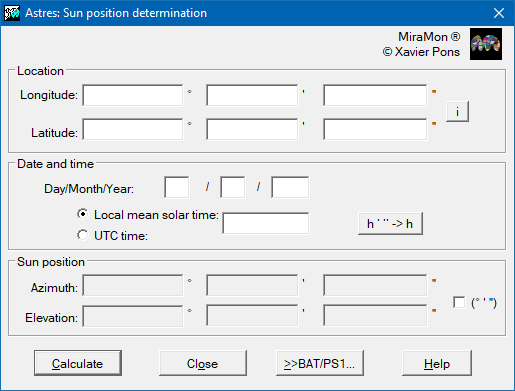
 Compute solar positionThe application computes, for a place in the Earth given in geographic coordinates, a day and a local solar hour or UTC, the azimuth and elevation of the Sun. For more information regarding the operation of the program, syntax, etc, please consult Astres: Obtention of the Sun azimuth and elevation in a place, a date and hour on the Earth.
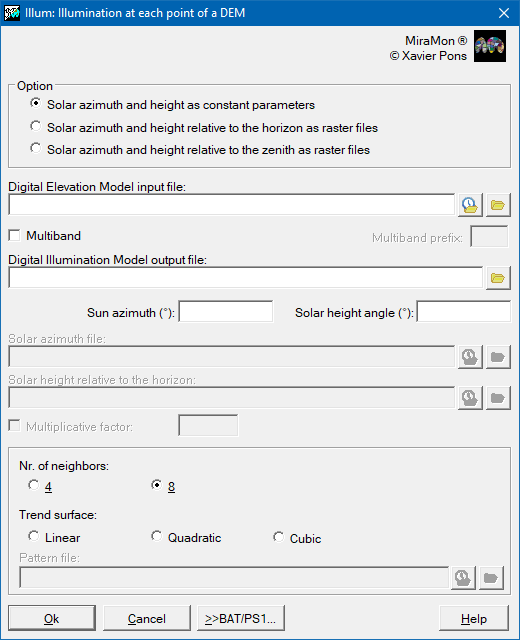
 Obtain Digital Illumination ModelThe application allows calculates, from a Digital Elevation Model (DEM), the illumination received by a point in the terrain when the Sun occupies a certain position in the celestial sphere. This position can be defined:
For more information regarding the operation of the program, syntax, etc, please consult Illum: Illumination at each point of a DEM.
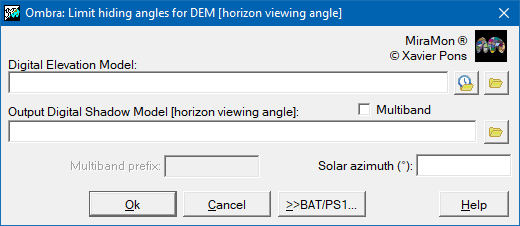
 Obtain Digital Shadow ModelThe application calculates, from a Digital Elevation Model (DEM) and a given solar azimuth, the Sun elevation angle from which each point in the terrain (raster cell) gets direct light from the Sun (the point is not under the shadow of another point in that azimuth direction). This program solves also the so called "horizon problem", i.e., it determines, for a given point in a given direction (azimuth) what is the elevation angle that allows from this point to see the sky. For more information regarding the operation of the program, syntax, etc, please consult Ombra: Calculation of the limit angles that cause projected shadows in a DEM.
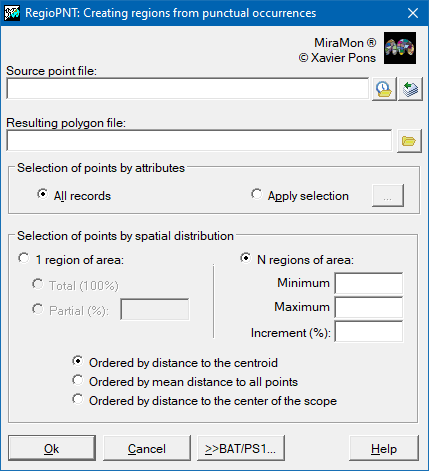
 Regions from point occurrencesThis application generates a polygon vectorial layer from the thematic and spatial grouping of points. Typically it is used in the determination of regions of activity, influences, attends, etc of a certain species or variable, habitually Boolean (0 or 1), from information received in punctual locations.
For more information regarding the operation of the program, syntax, etc, please consult RegioPNT: Creating regions from punctual occurrences.
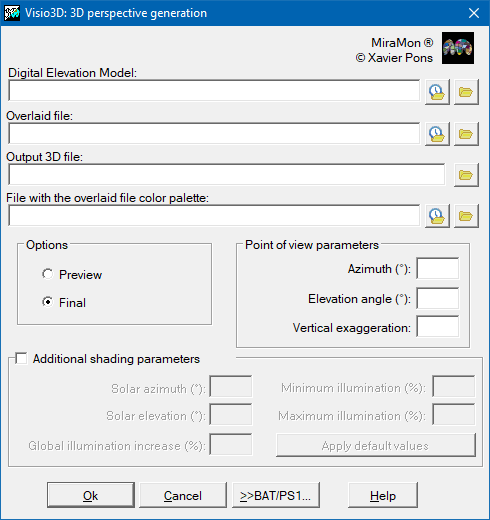
 3D perspective generationThe application allows the user to generate a 3D perspective from a digital elevation model of any image: thematic, orthophotography or any continuous model like the DEM. There are two run modes: the Preview and Definitive modes. The preview mode is faster than the definitive mode and is recommended for determining the geometric parameters that are closest to the desired representation. In this mode it is not possible to activatethe shading option. The definitive mode is slower but it produces a higher-quality three dimensional representation. For more information regarding the operation of the program, syntax, etc, please consult Visio3D: Generation of 3D perspectives based on a raster and its DEM.
Distance and network analysisThe distance and route analysis section groups together applications designed to evaluate and optimize travel in geographic space, allowing the user to calculate optimal routes, delimit areas of influence and identify the lowest cost paths according to various criteria. These functionalities are essential in areas such as transport, logistics, territorial planning or service management.
Buffer and distances map generationThe application allows the creation of both continuous distance maps (raster result) and influence maps (buffers) at a specified distance from the target entities (raster and vector result).
For more information regarding the operation of the program, syntax, etc, please consult BufDist: Influence areas (buffers) and distance maps generation.
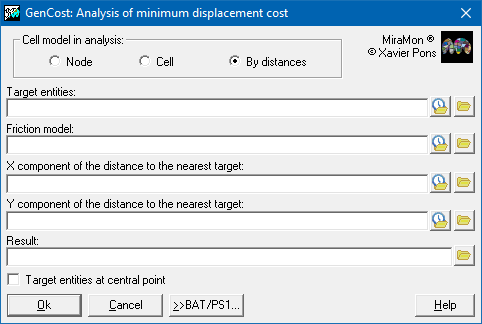
Least cost path analysisThe application creates a cost raster from a friction model (pass resistance) and a target entities raster that you wish to reach. For more information regarding the operation of the program, syntax, etc, please consult GenCost: Minimal cost analysis of motion over a friction model.
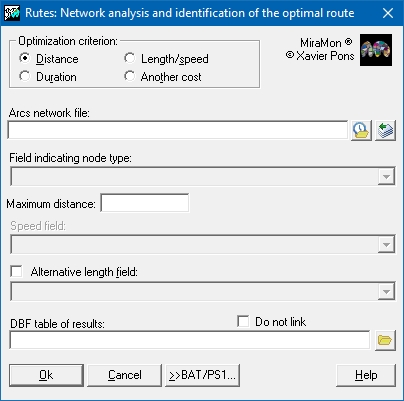
 Network analysis (paths)The application determines the optimum routes between a set of origin locations and a set of possible destination locations. The optimum route between a pair of origin-destination locations will be the that which minimizes the movement necessary to go from the origin to the destination, whether this be in time, distance or through the numerical field defined by the user that represents any other variable that calculates the cost of the movement. For more information regarding the operation of the program, syntax, etc, please consult Rutes: Network analysis and identification of the optimal route.
Modeling and other analysisThe modeling and other analysis section groups together applications that allow operations to be performed to explore relationships between variables, perform predictive modeling and advanced spatial analysis aimed at extracting spatial patterns from geographic and environmental data, being key in research projects, natural resource management, territorial planning or environmental conservation.
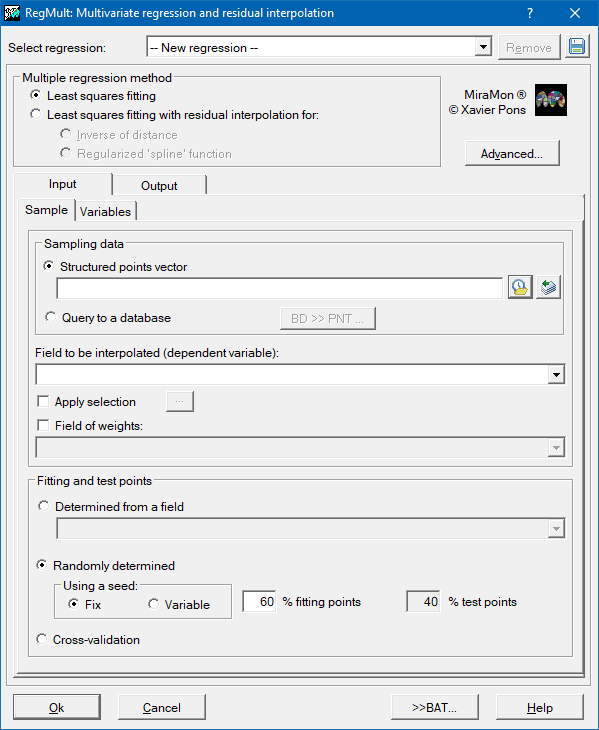
Multivariate regressionThis application constructs a predictive model of a Y spatial variable according to other (xn) independent spatial variables. For more information regarding the operation of the program, syntax, etc, please consult RegMult: Multivariate regression and residual interpolation.
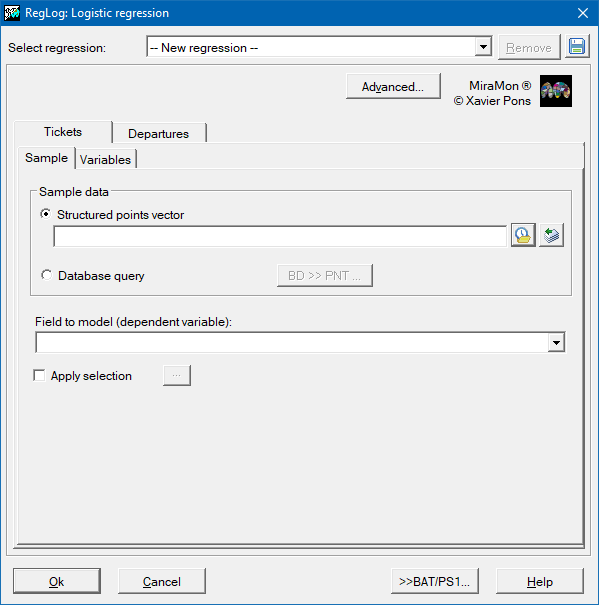
 Logistic regressionThis application allows generating an explanatory and predictive model of a Y spatial dichotomous variable based on n quantitative Xn independent spatial variables. The Y dependent variable will be dichotomous and, therefore, the numeric values it will take will be either 1 or 0 (presence/absence, yes/no, success/failure...). The purpose of the analysis is predicting that Y variable takes value 1 according to the values of the explanatory variables, P(Y=1|X), and to evaluate the relationship or effect of those on the dependent variable. For more information regarding the operation of the program, syntax, etc, please consult RegLog: Logistic regression.
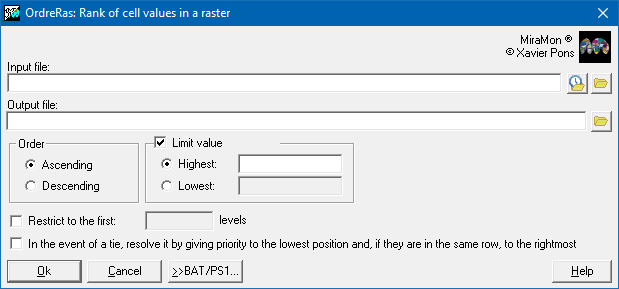
 Rank of cell values in a rasterThis application generates a raster image of indexes according to the order (ascending or descending) that corresponds to the original input raster values. The most common use of this application is in multicriteria modeling. For more information regarding the operation of the program, syntax, etc, please consult OrdreRas: Rank of cell values in a raster.
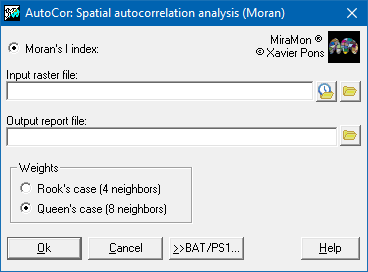
 Spatial autocorrelation analysis (Moran)The application allows quantifying the degree of spatial autocorrelation of a variable in a raster file by calculating an indicator, in this case the Moran's I(i) index. Spatial autocorrelation is a property present in the spatial distribution of a variable if the values at any location are influenced by values at nearby locations. For more information regarding the operation of the program, syntax, etc, please consult AutoCor: Spatial autocorrelation analysis (Moran).
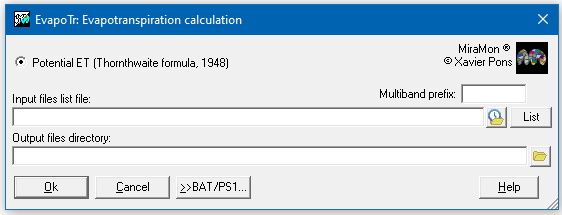
 Evapotranspiration calculationThe application calculates evapotranspiration. The only option available is the calculation of potential evapotranspiration with the formula of Thornthwaite 1948. For more information regarding the operation of the program, syntax, etc, please consult EvapoTr: Calculation of evapotranspiration.
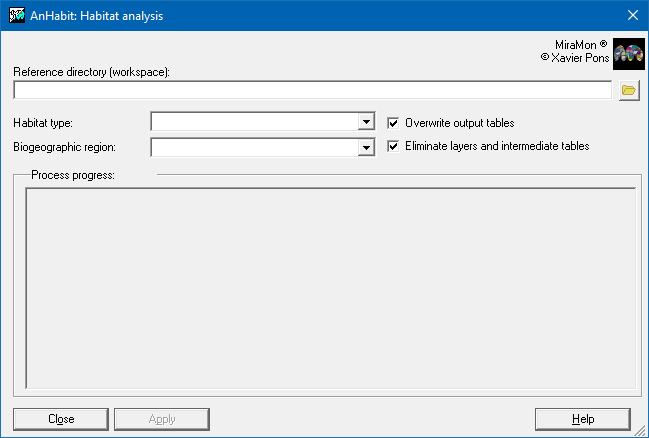
 Habitat analysisThe application allows analyzing layers of habitats in a biogeographic region and determines the representation level (in percentage) of a selection of those habitats on a set of interest areas differentiated by a code (interest areas). For more information regarding the operation of the program, syntax, etc, please consult AnHabit: Habitats analysis.
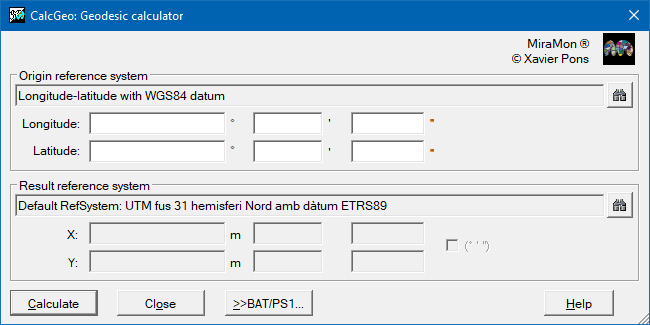
GeometryThe geometry section groups together applications intended to manage, transform and correct spatial information to guarantee its accuracy and coherence in the geographical field. These operations are essential for preparing data that will later be used in analyses, maps or modelling processes, ensuring that the results are reliable and compatible with different reference systems. Geodetic calculatorThe application allows the conversion of the coordinates of a point in a given reference system to the coordinates in another reference system. For more information regarding the operation of the program, syntax, etc, please consult CalcGeo: Geodetic calculator.
 Change of Geographic Reference System (projection, datum, etc)The application allows to transform from one projection system to another and also, to change the reference system by setting the projection parameters, the datum, the ellipsoid, etc. It works on raster files (IMG), non structured vector files (VEC) and structured vector files of points (PNT), arcs (ARC) and polygons (POL). To transform node (NOD) files, it is required to transform their associated arc files.
For more information regarding the operation of the program, syntax, etc, please consult CanviPrj: Change of Geographic Reference System (projection, datum, etc).
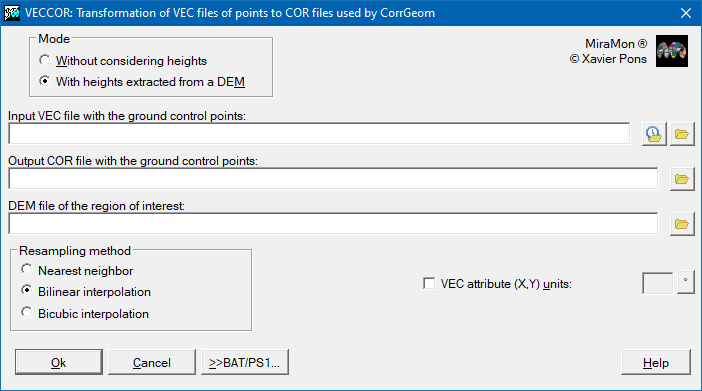
 Converting VEC to control points (COR)The application a transforms VEC files of point to the working format of CorrGeom application which allows you to transform files from practically any scanner (BMP, TIFF, JPG, etc. formats) into IMG or JPG format (if they were not originally). For more information regarding the operation of the program, syntax, etc, please consult VECCOR: Transformation of VEC files of points to COR files used by CorrGeom.
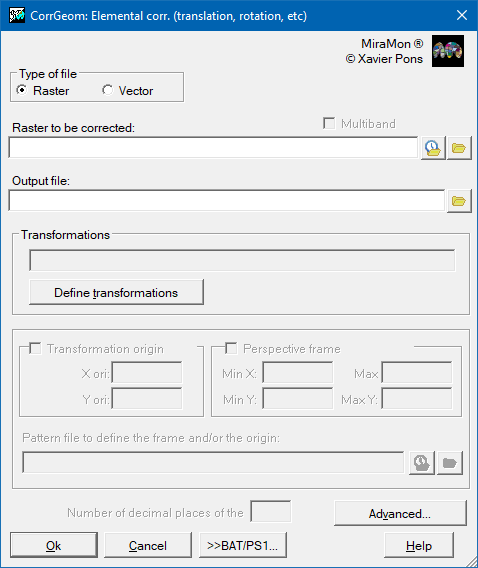
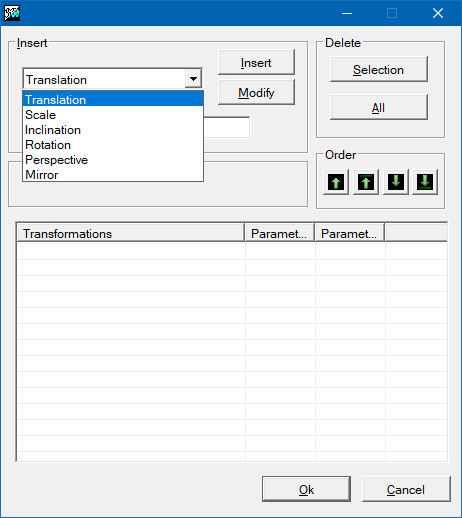
 Open ground control points file (COR)The application allows opening the control point file that allows the user to perform geometric correction with the application CorrGeom. Elemental corrections (translation, rotation)The application allows you to apply geometric transformations to both rasters and vectors, indicating the parameters of the transformation that are known a priori. The operations offered are: translations, scaling, tilts, rotations, perspectives and mirrors. For more information regarding the operation of the program, syntax, etc, please consult CorrGeom: Geometric correction of raster and vector files.
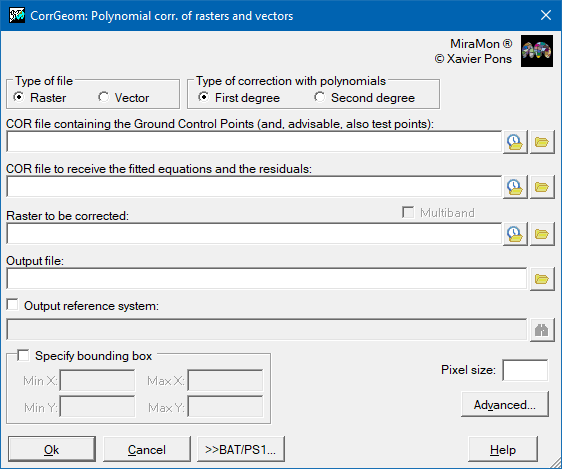
  Polynomial corrections (rasters and vectors)The application allows the geometric correction of rasters (IMG and JPG: satellite images aerial photographs, scanned maps...) or vector layers (VEC, PNT, ARC and their derivatives POL and NOD) using a series of n known control points:
Once in the appropriate projection system, the images can be superimposed on other images and vector layers in the same projection system. For more information regarding the operation of the program, syntax, etc, please consult CorrGeom: Geometric correction of raster and vector files.
 Satellite orthoimage generationThe application allows the geometric correction of aerial photographs or satellite images in order to eliminate the deformations produced by the shooting perspective and the terrain relief, thus obtaining an image adjusted to a known cartographic projection system (e.g. UTM). For more information regarding the operation of the program, syntax, etc, please consult CorrGeom: Geometric correction of raster and vector files.
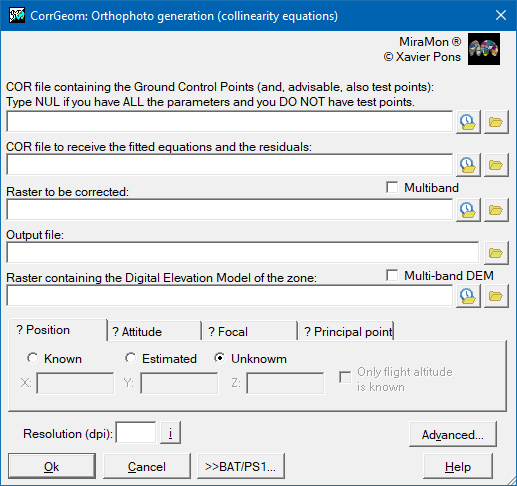
 Orthophoto generationThe application allows the generation of orthophotos, a process very similar to the generation of orthoimages, but applied specifically to aerial photographs. The objective is to transform a photograph taken from an airplane (or drone) into a cartographically accurate image, correcting the deformations caused by the perspective of the camera and the relief of the terrain, so that each point in the photo is located in its real position on the map. For more information regarding the operation of the program, syntax, etc, please consult CorrGeom: Geometric correction of raster and vector files.
 Convert Deg/Hours, Min, Sec to Deg/RadThe application allows conversions between angular magnitudes:
as well as between time magnitudes:
For more information regarding the operation of the program, syntax, etc, please consult gms_g: Conversion between angle/hour units.
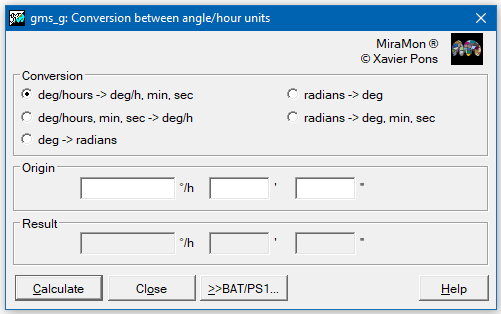
Image radiometryThe image radiometry section groups together applications designed to analyze and correct the energy properties of images captured by optical or thermal sensors, with the aim of ensuring that the recorded values ??reliably reflect the real conditions of the earth's surface. This set of functionalities allows from obtaining lighting and shadow models or calculating the solar position, to more advanced processes such as radiometric correction, calculating emissivities and estimating surface temperature. It also includes angular conversion tools (degrees/hours, minutes and seconds to decimal degrees) that facilitate the processing and integration of data in geographic information systems (GIS). Thanks to these operations, it is possible to improve the quality of images, obtain reliable physical parameters and promote highly precise environmental, climatic and territorial analyses.
Compute solar positionThe application computes, for a place in the Earth given in geographic coordinates, a day and a local solar hour or UTC, the azimuth and elevation of the Sun. For more information regarding the operation of the program, syntax, etc, please consult Astres: Obtention of the Sun azimuth and elevation in a place, a date and hour on the Earth.
Obtain Digital Illumination ModelThe application allows calculates, from a Digital Elevation Model (DEM), the illumination received by a point in the terrain when the Sun occupies a certain position in the celestial sphere. This position can be defined:
For more information regarding the operation of the program, syntax, etc, please consult Illum: Illumination at each point of a DEM.
Obtain Digital Shadow ModelThe application calculates, from a Digital Elevation Model (DEM) and a given solar azimuth, the Sun elevation angle from which each point in the terrain (raster cell) gets direct light from the Sun (the point is not under the shadow of another point in that azimuth direction). This program solves also the so called "horizon problem", i.e., it determines, for a given point in a given direction (azimuth) what is the elevation angle that allows from this point to see the sky. For more information regarding the operation of the program, syntax, etc, please consult Ombra: Calculation of the limit angles that cause projected shadows in a DEM.
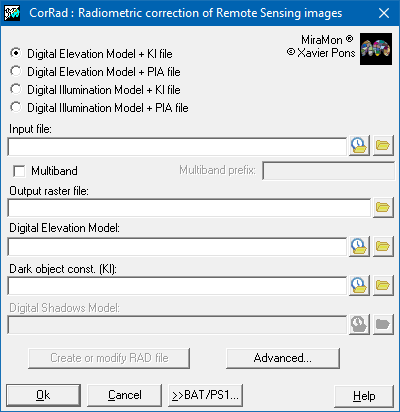
Radiometric correctionThe application allows the radiometric correction of remote sensing images captured in the visible and non-thermal infrared spectral regions. The radiometric correction allows to reduce the number of undesired artifacts that are due to the effects of the atmosphere or to the differential illumination which is in turn due to the time of the day, the location in the Earth and the relief (zones that are more illuminated than others, shadows, etc). The program has been prepared for images Landsat (MSS, TM, ETM+, OLI,...), SPOT (XS), Sentinel-2 (MSI), etc, and can be used for almost any other spatial or airborne sensor by using files of RAD type. For more information regarding the operation of the program, syntax, etc, please consult CorRad: Radiometric correction of Remote Sensing images.
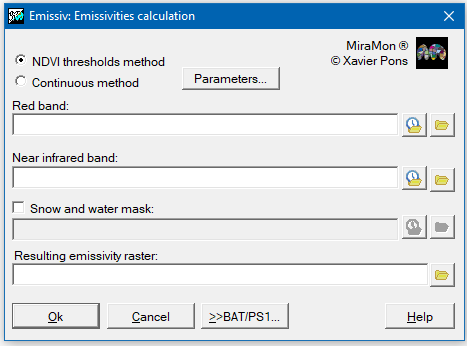
 Emissivity computingThis application allows calculating emissivity based on a red band and an infrared band. A mask could be added for water and snow areas, by allocating a "1" value in water areas and a "2" value in snow areas. The red band, the infrared band and the mask (in the case it is added) must have the same field, resolution and reference system for a correct functioning in the application. Two methods are available:
For more information regarding the operation of the program, syntax, etc, please consult Emissiv: Emissivities calculation.
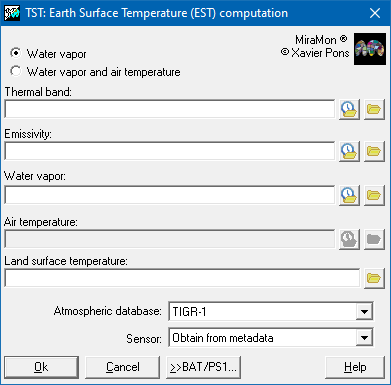
 Surface temperature computingThe application is used to calculate the temperature of Earth surface according to emissivity data, steam, and a thermal band. Air temperature data could also be added. There are two options:
For more information regarding the operation of the program, syntax, etc, please consult TST: Earth Surface Temperature computation.
 Convert Deg/Hours, Min, Sec to Deg/RadThe application allows conversions between angular magnitudes:
as well as between time magnitudes:
For more information regarding the operation of the program, syntax, etc, please consult gms_g: Conversion between angle/hour units.
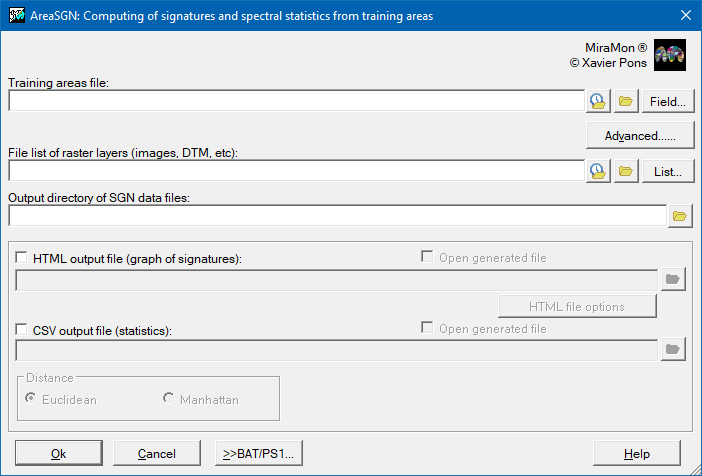
Image classificationThe Image Classification section includes a set of applications designed to identify and assign categories to the different areas of an image based on their spectral and statistical characteristics. These applications range from obtaining spectral signatures and statistics, which describe the behavior of the data, to classification methods such as unsupervised, supervised or hybrid (mixed), which combine the two approaches. Specific algorithms such as the classifier by number of nearest neighbors (k-NN) are also included, as well as tools for evaluating results, such as generating confusion matrices, and refinement procedures such as the selective filter, which improve the accuracy of the classifications obtained. Computing of spectral signatures and statisticsThis application creates the SGN spectral signature files of all the spectral bands of an image from some training areas. The training areas can be provided through a categorical raster or through a layer of polygons. The categorical raster can be obtained through applications of classification algorithms such as IsoMM, ClasSup o ClaskNN,or by rasterizing a polygon layer. For more information regarding the operation of the program, syntax, etc, please consult AreaSGN: Creation of signatures and spectral statistics from training areas.
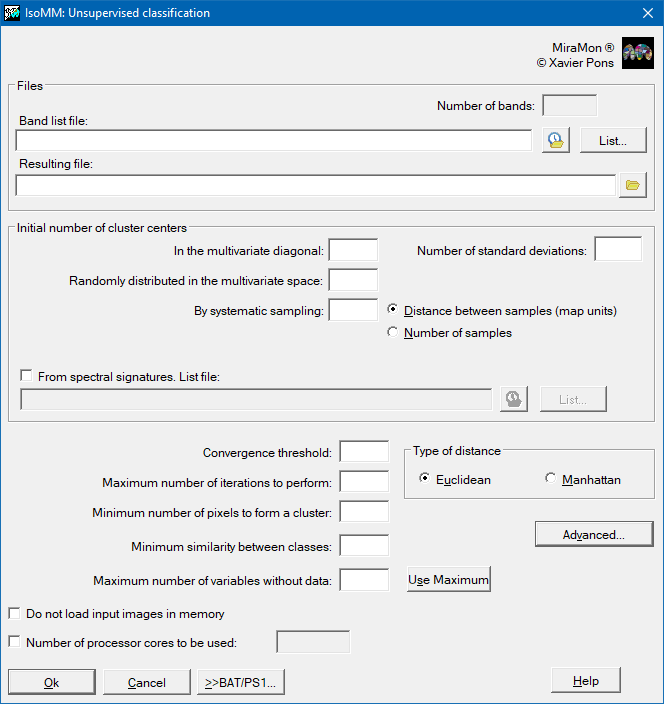
 Unsupervised classificationThis application performs an unsupervised image classification based on Duda and Hart's IsoData method: Duda, RO, PE Hart (1973) "Pattern Classification and Scene Analysis", John Wiley and Sons, New York, [cap. 6, "Unsupervised Learning and Clustering", pp. 226-227]. When executing the classifier in MiraMon (IsoMM), the application begins with a certain number of cluster categories which are defined by the user. For more information regarding the operation of the program, syntax, etc, please consult IsoMM: Unsupervised classification.
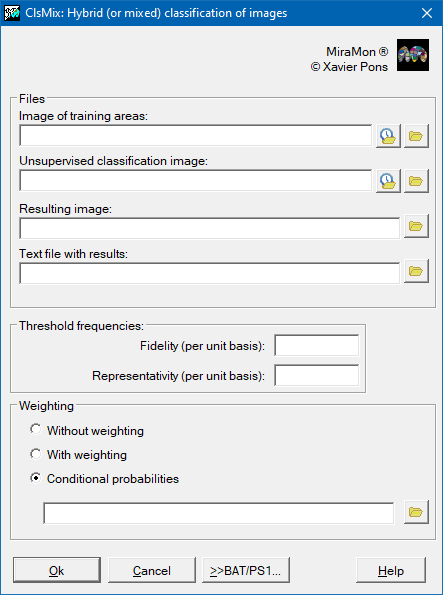
 Hybrid (mixed) classificationThe application allows the hybrid (or mixed) classification of remote sensing images. The adjective hybrid (or mixed) is used because the classification method combines elements of a supervised classification (the training areas) with elements of an unsupervised classification (the results of the latter). In this way, starting from an image in which there are several training areas and an image produced through an unsupervised classification method, a new classified image is created. It is suggested the MiraMon IsoMM application for the unsupervised classification method. For more information regarding the operation of the program, syntax, etc, please consult ClsMix: Hybrid (or mixed) classification of images.
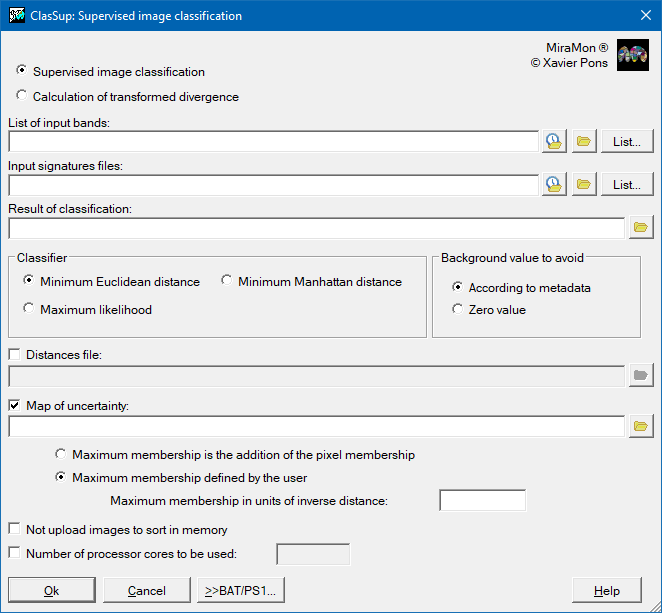
 Supervised classificationThe application does a supervised classification based on classical classifiers as: minimum Euclidean distance, minimum Manhattan distance and maximum likelihood. The signatures that define each class are read from SGN files, previously generated (for instance with AreaSGN or IsoMM). It also allows calculating the transformed divergence (DT) to evaluate the separability between classes. The program can also generate a raster with the distance or probability of belonging of each pixel to the assigned class, useful for assessing the reliability of the classification. It describes criteria for interpreting these distances and considerations regarding variable normalization, execution time (which varies depending on the classifier) ??and the impact of the number of variables with missing data. For more information regarding the operation of the program, syntax, etc, please consult ClasSup: Supervised image classification.
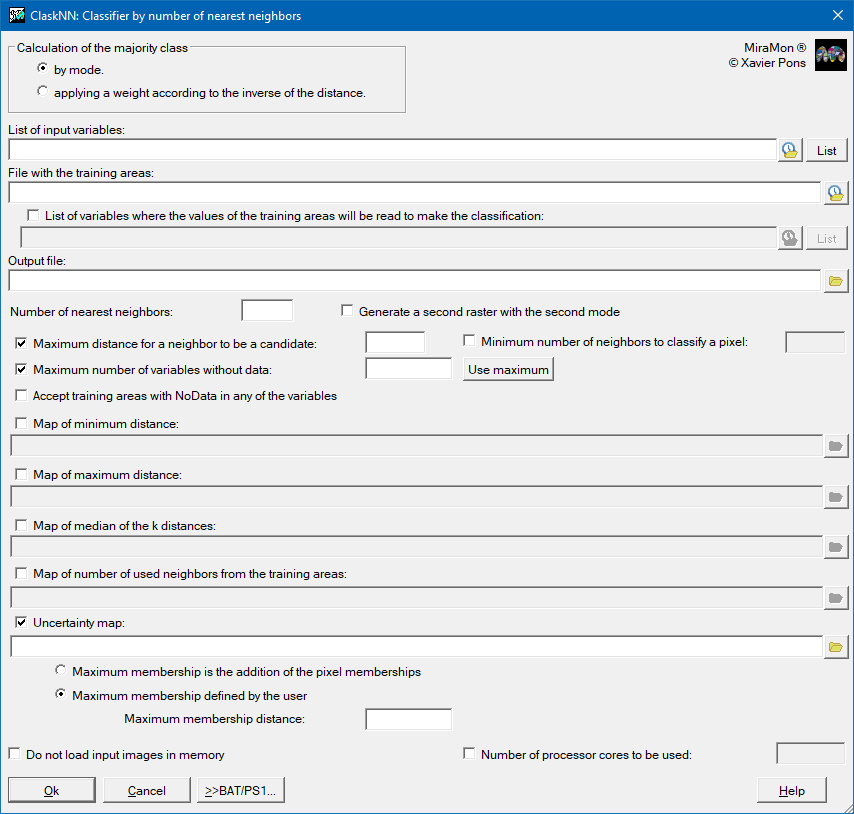
 Number of nearest neighbors (k-NN) classificationThe application performs a supervised classification of an image (monoband or multiband) using the k-NN method. k-NN is the acronym for k (which refers to a preset number of pixels from the pixels used to define the desired classes on the categorical map to be obtained) and NN (nearest neighbors). The method assumes that it is plausible that the pixels that are close to each other in the statistical space belong to the same informational class. For each pixel of the image to be classified, the Euclidean distance (on the statistical space of representation of the independent variables) is calculated to each pixel of the training areas. The k nearest training areas pixels are chosen and the predominant class of this group of k pixels is the class that is assigned to the pixel to be classified. For more information regarding the operation of the program, syntax, etc, please consult ClaskNN: Number of nearest neighbors classificator.
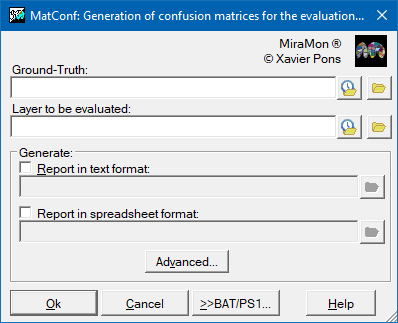
 Generation of error matricesThe application creates a 'Confusion Matrix', a two dimensional table comparing the classified image data with reference to ground truth data. The output format may be a text file or a file in spreadsheet format (CSV). For more information regarding the operation of the program, syntax, etc, please consult MatConf: Generate a confusion matrix for evaluating thematic maps.
 Selective FilterThis application takes a raster and substitutes the cells (pixels) which have a value equal to a previously selected value (value to substitute) with the value of the majority of the cells surrounding that cell (mode) or the average of the neighboring values. The neighborhood is defined by the convolution window, which is square and has an odd number of pixels. The file to be processed is a raster in any format (byte, short integer, unsigned integer o real), compressed or uncompressed. The result of the process will be another raster in the same format. For more information regarding the operation of the program, syntax, etc, please consult FagoVal: Selective filtering of raster values.
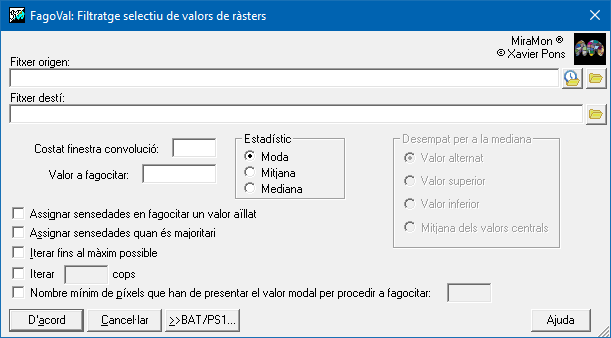
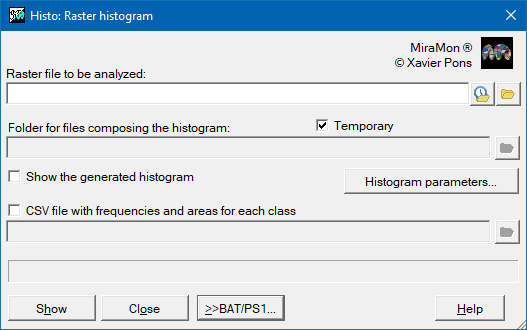
Image processingThe image processing section offers a wide range of tools for analyzing, transforming, and extracting relevant information from raster data. This suite of programs includes basic functions such as histogram creation, pixel dilation, and cell subset selection, as well as statistical analysis procedures such as raster statistics calculation, image correlation, and spatial autocorrelation analysis (Moran). It also incorporates spectral information transformation and enhancement techniques such as color space transformations (24-X8, HSI), principal component analysis, tasseled-cap transformation, and histogram optimization at global or local scales. In addition, it allows applying filters (including selective ones), generate confusion matrices to evaluate results and calculate specific indicators such as vegetation, snow or water indices, SPI and SPEI drought indices or the Terrestrial Connectivity Index, thus facilitating a completer and more precise environmental and territorial analysis. HistogramThe application generates a histogram of frequencies of a raster in IMG format, to display it on the screen and to save the result obtained in a CSV file with the frequencies and areas for each class in order to perform a deeper analysis in a spreadsheet.
For more information regarding the operation of the program, syntax, etc, please consult Histo: Histogram of a raster.
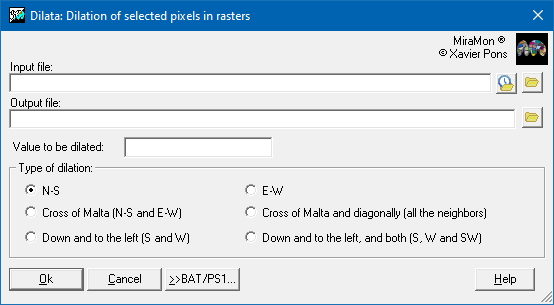
 Dilation of pixels in raster filesThe application takes a value from a pixel and replicates it in the geometric immediate surroundings. The dilation can also be used as an approximation to a directional or radial buffer with a pixel size (or pixel by square root of 2 for expansion on all neighbors), to apply around raster areas or rasterized linear elements. For more information regarding the operation of the program, syntax, etc, please consult Dilata: Dilation of pixels of a selected value in raster files.
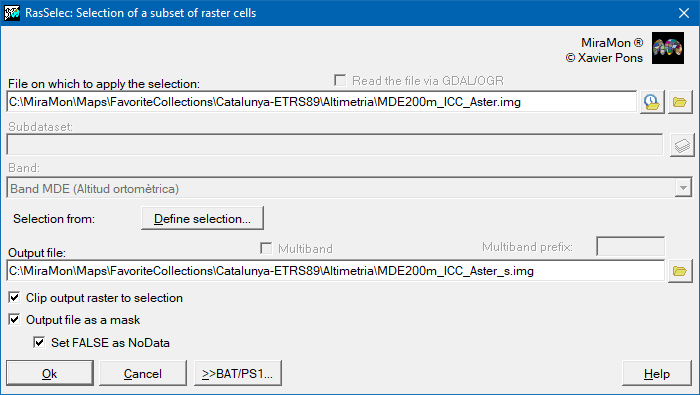
 Selection of a subset of raster cellsThe application selects a subset of cells from a single-band or multiband raster, from the IMG format or by reading the file through the GDAL/OGR libraries. For more information regarding the operation of the program, syntax, etc, please consult RasSelec: Selection of a subset of raster cells.
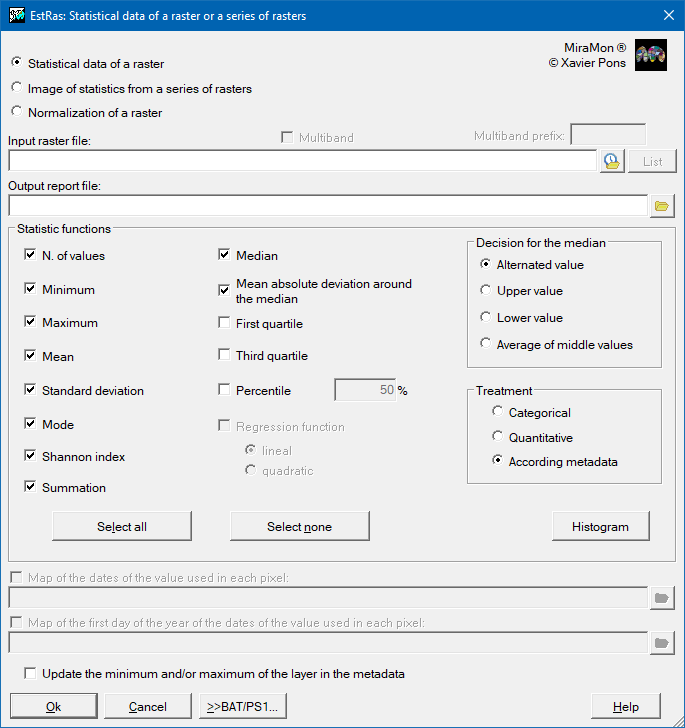
 Rasters statisticsThe application calculates statistical data of raster images in which it is possible to choose between three options:
For more information regarding the operation of the program, syntax, etc, please consult EstRas: Statistical data of a raster or a raster series.
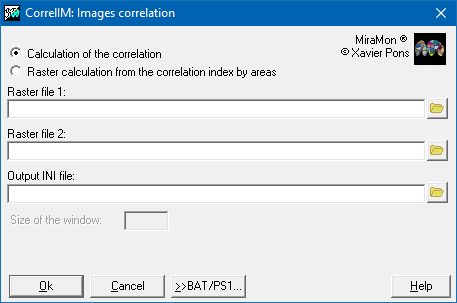
 Images correlationThe application adjusts a regression line between the values of the first raster, which acts as an independent variable, and the second raster, which acts as a dependent variable. This adjustment gives rise to the corresponding correlation coefficient r (Spiegel 1991, 2nd edition, McGraw-Hill) and defines the slope and the independent term that characterize the correlation between the two variables. The application can do this calculation globally or regionally. For more information regarding the operation of the program, syntax, etc, please consult CorrelIM: Images correlation.
 Spatial autocorrelation analysis (Moran)The application allows quantifying the degree of spatial autocorrelation of a variable in a raster file by calculating an indicator, in this case the Moran's I(i) index. Spatial autocorrelation is a property present in the spatial distribution of a variable if the values at any location are influenced by values at nearby locations. For more information regarding the operation of the program, syntax, etc, please consult AutoCor: Spatial autocorrelation analysis (Moran).
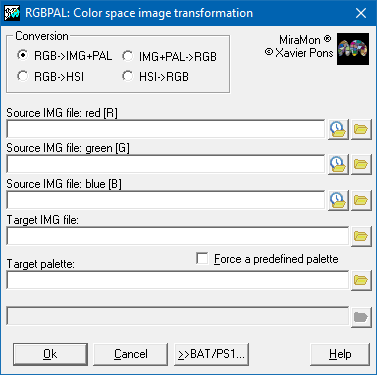
Color space transformations (24->8, HSI)The application allows transformations between different color spaces. For example, it can transform a paletted byte image (8-bit color coding) into 3 separate byte images (R, G, and B bands 24-bit color coding). It can also convert 3 byte images representing the R, G, and B bands to an 8-bit image (byte) and an optimized palette, obtained from the analysis of the most frequent and unique colors present in the 3 original images; alternatively, the 8-bit image can be generated using a preset palette. For more information regarding the operation of the program, syntax, etc, please consult RGBPal: Color space image transformation.
 Vegetation, snow, water, etc, indicesThe application allows to easily calculate vegetation indices and other indices of interest in remote sensing. Indices are spectral band combinations that enhance the contribution of certain components (typically vegetation) observed in the spectral response of a surface, minimizing other effects such as soil, illumination or atmosphere conditions, that can cause interference in the radiometric signal. For more information regarding the operation of the program, syntax, etc, please consult Indexs: Computing of indices of vegetation, snow, water, etc.
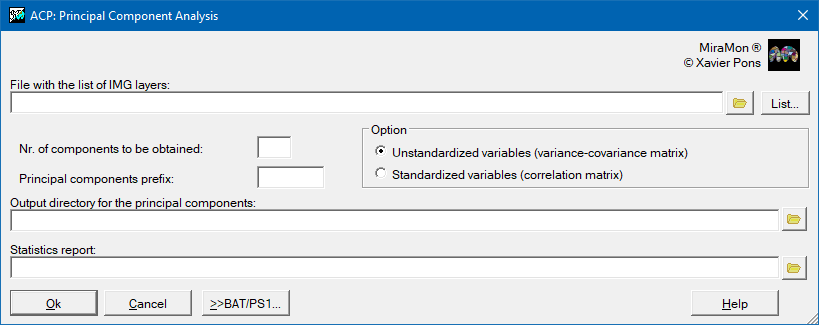
 Principal Components AnalysisThe application allows a Principal Component Analysis (PCA) on raster images (that are treated as variables), based on the variance - covariance matrix or correlation by calculating the corresponding eigenvalues and eigenvectors. The available options are:
For more information regarding the operation of the program, syntax, etc, please consult ACP: Principal Component Analysis.
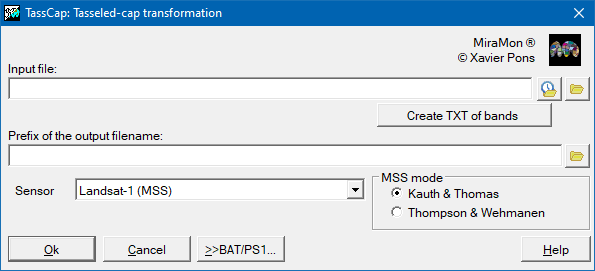
 Tasseled-cap transformationThe application allows obtaining new bands from a linear combination of the original. The new bands have a precise physical meaning: the SBI inform on changes in the total reflectivity of the scene, the GVI indicate the contrast between visible and near infrared bands, closely related to vegetation activity; the YVI is related to the amount of water in vegetation and soil, so that it is usually called wetness index. It has also called maturity index since its relation to the vegetation cover maturity (age, cover density, etc.); finally, the NSI is sensitive to water vapor absorption, although most of its component is noise. For more information regarding the operation of the program, syntax, etc, please consult TassCap: Tasseled-cap transformation.
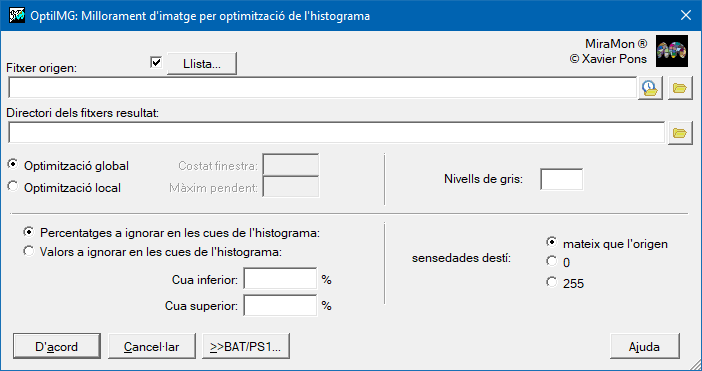
 Histogram optimization (global, local)The application improves the images by globally histogram optimization or locally optimizing the histogram using a window with a size defined by the user. This second option gives much more contrasted results, although it is slower.
For more information regarding the operation of the program, syntax, etc, please consult OptiIMG: Image enhancement by optimizing the histogram.
 FilterThe application generates a raster as the result of the application of a specified convolution filter to an input raster. Each pixel in the input raster is substituted in the output raster by the result of the calculation defined according to the filter. This calculation uses all the pixels in a square window, defined by the user, centered on the original pixel and which has an odd number of pixels along each side. For more information regarding the operation of the program, syntax, etc, please consult Filtres: Indiscriminate filtering of raster values.
 Selective FilterThis application takes a raster and substitutes the cells (pixels) which have a value equal to a previously selected value (value to substitute) with the value of the majority of the cells surrounding that cell (mode) or the average of the neighboring values. The neighborhood is defined by the convolution window, which is square and has an odd number of pixels. The file to be processed is a raster in any format (byte, short integer, unsigned integer o real), compressed or uncompressed. The result of the process will be another raster in the same format. For more information regarding the operation of the program, syntax, etc, please consult FagoVal: Selective filtering of raster values.
Generation of error matricesThis application creates a 'Confusion Matrix', a two-dimensional table comparing the classified image data with reference to ground truth data. The output format may be a text file or a file in spreadsheet format (CSV). For more information regarding the operation of the program, syntax, etc, please consult MatConf: Generate a confusion matrix for evaluating thematic maps.
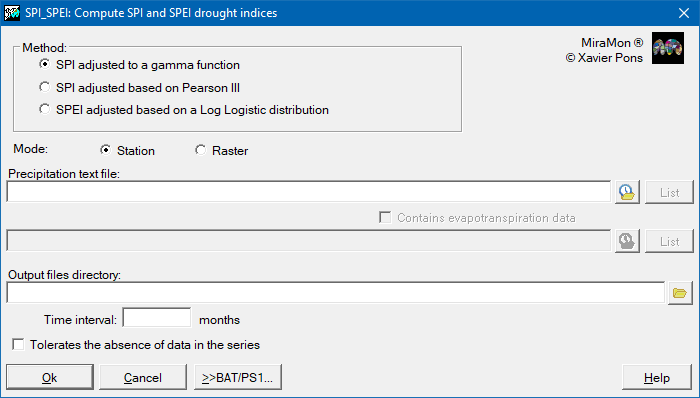
Computing SPI and SPEI drought indicesThe application allows to calculate the drought index SPI and SPEI. Currently the following indexes have been implemented:
For more information regarding the operation of the program, syntax, etc, please consult SPI_SPEI: Computing of SPI and SPEI drought indices.
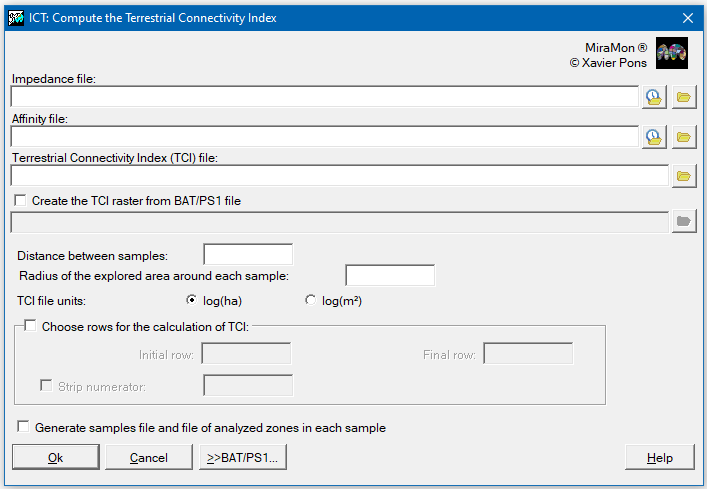
 Computing the Terrestrial Connectivity IndexThe application allows generating a raster layer in which each cell of the territory receives a value that expresses the degree of ecological connectivity of the soil according to its proximity and size with respect to other similar habitats. The index incorporates both the surface of the tile (habitat patch) and the effect of nearby infrastructures and urban areas that can reduce connectivity, and quantifies the availability of each type of cover through a weighting that combines distance and affinity between habitats (ICTi) to finally gather an overall value (ICT) for each pixel.
For more information regarding the operation of the program, syntax, etc, please consult ICT: Compute the Terrestrial Connectivity Index.
Cartographic generalizationGeneralization applications simplify and optimize geographic information, reducing its complexity without losing its essence. In the case of raster data, indiscriminate generalization applies smoothing or cell aggregation processes globally, while selective generalization acts only on specific areas according to defined criteria. In vector data, these tools include line generalization, which reduces the number of points in a geometry while maintaining its main shape, polygon edge generalization, which simplifies the boundaries to make them cleaner, and polygon elimination, which allows the user to delete small or irrelevant elements. This set of operations facilitates the analysis and visualization of spatial information, especially in large-scale work or when lighter and more efficient files are required.
RasterRaster: Indiscriminate generalizationThe application generates a raster as the result of the application of a specified convolution filter to an input raster. Each pixel in the input raster is substituted in the output raster by the result of the calculation defined according to the filter. This calculation uses all the pixels in a square window, defined by the user, centered on the original pixel and which has an odd number of pixels along each side. For more information regarding the operation of the program, syntax, etc, please consult Filtres: Indiscriminate filtering of raster values.
Raster: Selective generalizationThis application takes a raster and substitutes the cells (pixels) which have a value equal to a previously selected value (value to substitute) with the value of the majority of the cells surrounding that cell (mode) or the average of the neighboring values. The neighborhood is defined by the convolution window, which is square and has an odd number of pixels. The file to be processed is a raster in any format (byte, short integer, unsigned integer o real), compressed or uncompressed. The result of the process will be another raster in the same format. For more information regarding the operation of the program, syntax, etc, please consult FagoVal: Selective filtering of raster values.
VectorVector: Line generalizationThe application generalizes the lines of a line layer (ARC or VEC of lines).
For more information regarding the operation of the program, syntax, etc, please consult GenVLin: Line generalitzation.
 Vector: Polygon boundary generalizationThe application generalizes the borders (arcs) of a polygon layer.
For more information regarding the operation of the program, syntax, etc, please consult GenVPol: Polygons borders generalization.
 Vector: Polygon droppingThe application allows the elimination of polygons, often micropolygons, defined as small objects, sometimes elongated, and often without a thematic label. That is why they have a small area, a small area/perimeter ratio (large perimeter and small area) and that they have not been labeled. This application incorporates these three criteria and an additional criterion to be able to mark a polygon as eliminable through a logical field in the main polygon database. For more information regarding the operation of the program, syntax, etc, please consult MicroPol: Erase polygons and micropolygons of a polygon or categorical raster layer.
Raster-vector conversionRaster and vector data conversion applications constitute a set of fundamental procedures in the field of digital cartography and geographic information systems (GIS), since they enable the adaptation of the spatial information format to the specific needs of analysis or cartographic representation.
Rasterization of points, lines and polygonsThis application takes a vector point file, a line/arc file, a polygon or node file (whether structured or not) and rasterizes it using an existing or new raster. For more information regarding the operation of the program, syntax, etc, please consult TiraVec: Rasterize vector files.
Vectorization of categorical rastersThe application vectorizes one or several categorical raster files (land cover maps, geological maps, etc) to create a topologically structured polygon file. For more information regarding the operation of the program, syntax, etc, please consult RasTop: Vectorization of categorical rasters.
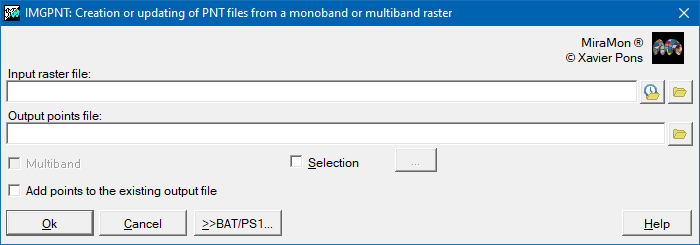
 Vectorization of rasters to pointsThe application allows to obtain a points file from a monoband or multiband raster file, so that the value of each cell in the raster will be saved in a field in the database table of the points file. For more information regarding the operation of the program, syntax, etc, please consult IMGPNT: Creation or updating of PNT files from a monoband or multiband raster.
GPSGPS operations in a geographic information system constitute a fundamental tool for the integration of field geospatial data with the digital environment. Operations such as recording and immediately visualizing positions and paths on the map and interoperability between spatial management devices and software are fundamental tools to ensure an efficient connection between fieldwork and cartographic analysis in the GIS.
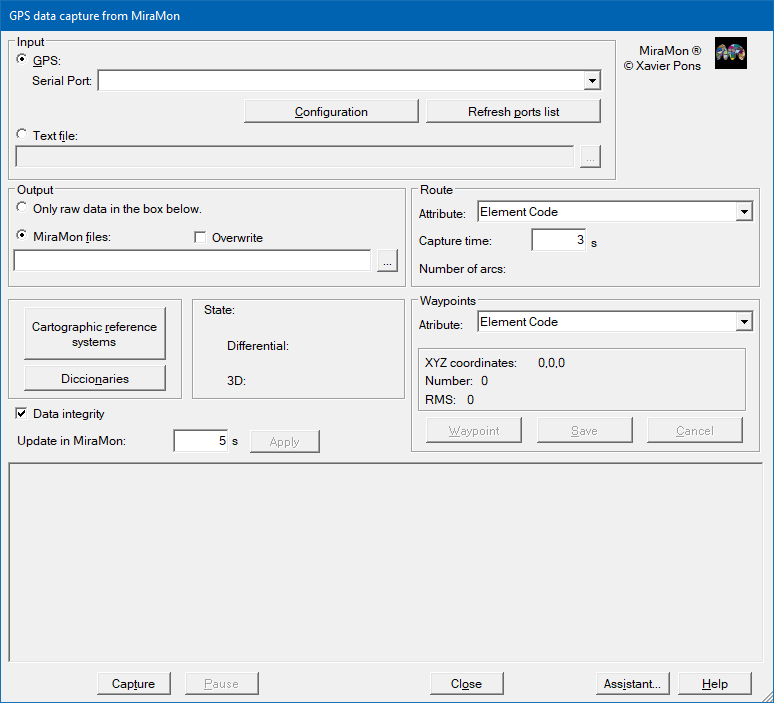
GPS data capture in real timeThe application allows capturing data transmitted by a GPS and converts it into a line file that is represented in real time on the cartography (orthophoto, topographic maps, etc.). MiraMon positions the view appropriately depending on the position and time of the station (map moving) and displays, at all times, information on the status of the GPS tracking. For more information regarding the operation of the program, syntax, etc, please consult GPSMM: GPS data capture in real time.
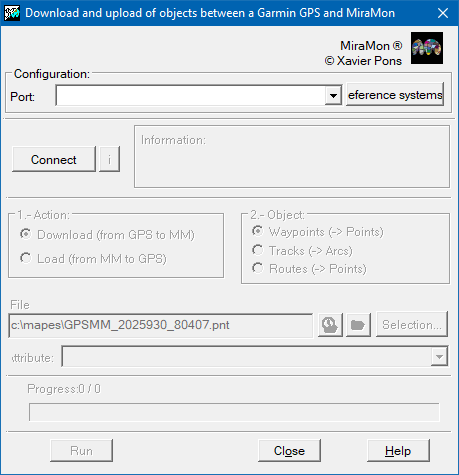
 Import/Export from GPS to MiraMonThe application loads and downloads objects (points and lines) from the models of GPS of the GARMIN range to MiraMon through the computer's serial and USB ports. For more information regarding the operation of the program, syntax, etc, please consult GarminMM: Data interchange with a Garmin GPS.
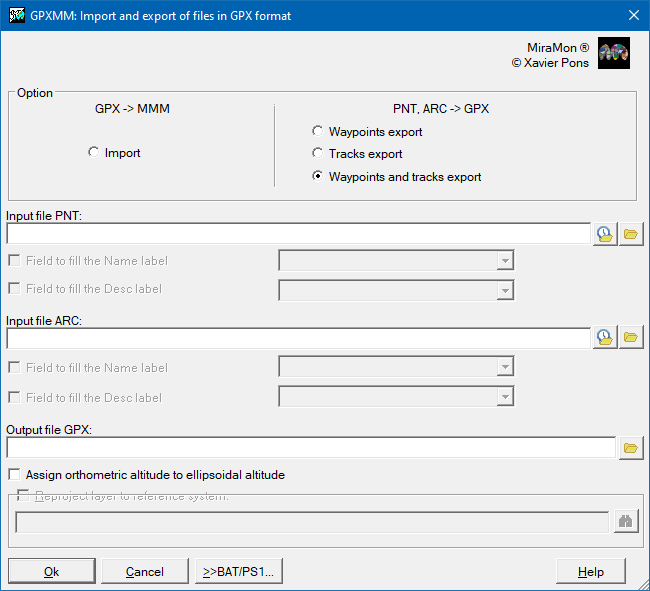
 Import from GPX (GPS eXchange Format) to MiraMonnThe application is used to convert a GPX format file (GPS eXchange Format) into MiraMon structured vector format (PNT, ARC/NOD) and viceversa. For more information regarding the operation of the program, syntax, etc, please consult GPXMM: Import and export between GPX and MiraMon format.
Windows Scientific CalculatorThe tools menu allows you to directly open the Windows scientific calculator, which is useful in various processes with rasters and vectors and because it exemplifies that it is feasible to access other applications from the MiraMon menu. For more information on customizing the menus, you can consult the Menus section of the Parameter Configuration explanation included in the Help menu.
NotepadThe Tools menu has incorporated access to Notepad, similar to the case explained for the Windows Scientific Calculator, because it is useful on numerous occasions and because it exemplifies that it is viable to provide access to other applications from MiraMon. For more information on customizing the menus, you can consult the Menus section of the explanation of Parameter Configuration included in the Help menu.
|

